How to Calculate WACC: The Complete Step-by-Step Formula for Corporate Valuation
A 100-basis-point WACC error can swing a $500M valuation by $40–80M. This guide delivers the exact formula and five critical inputs corporate operators need to get the discount rate right.
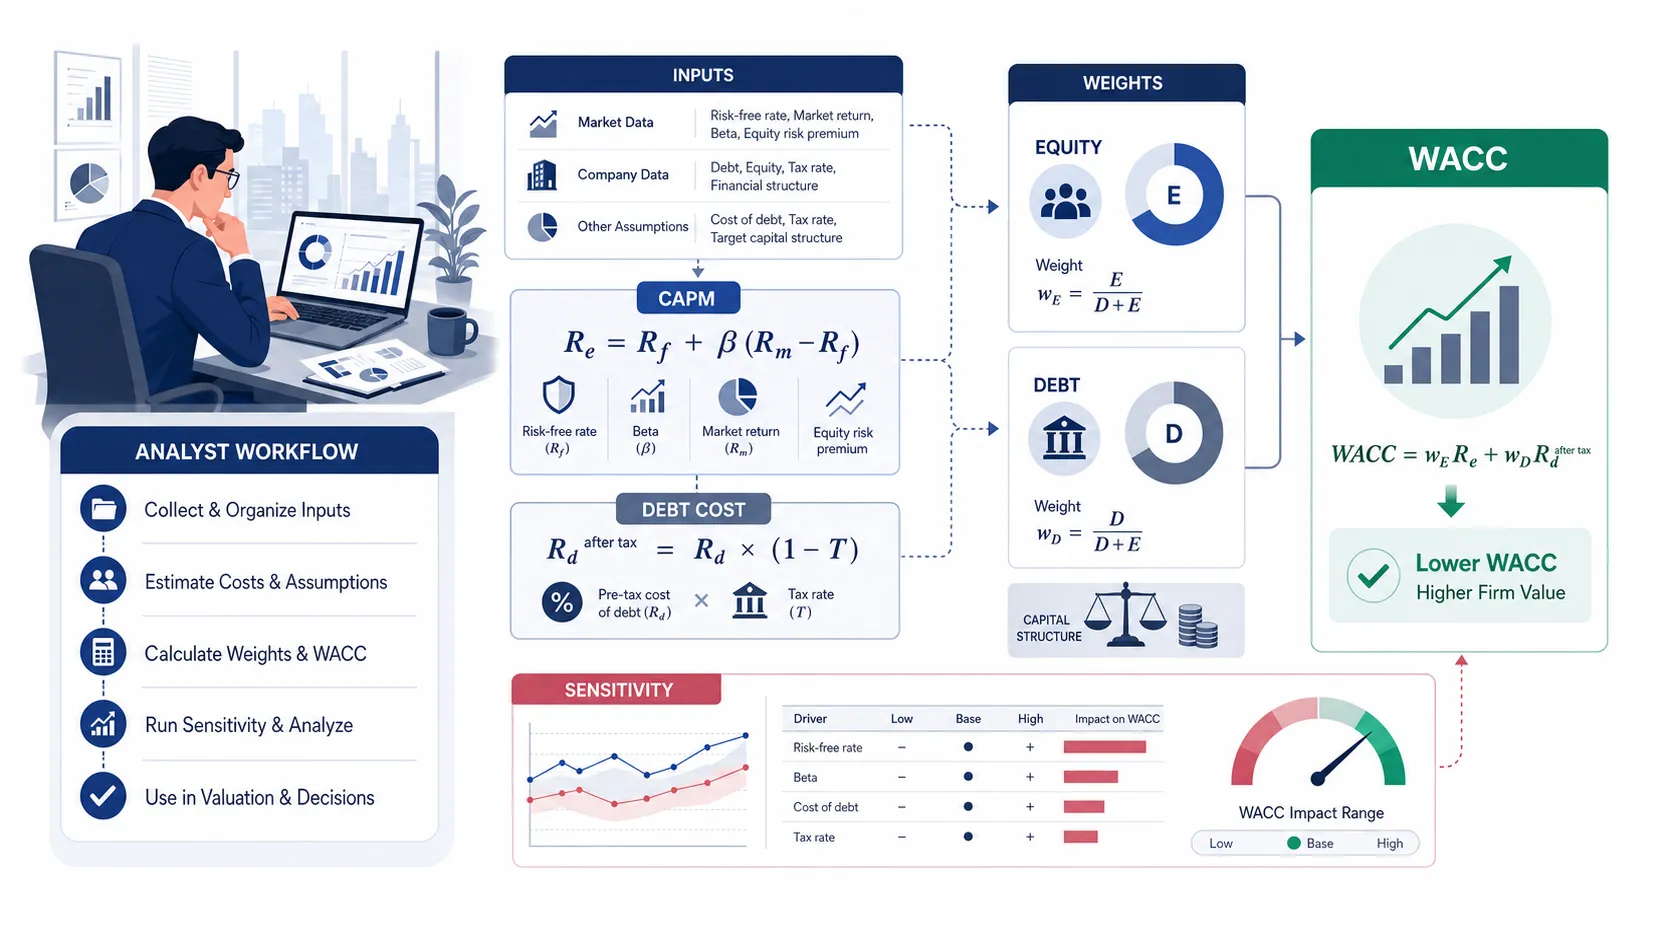
To calculate WACC, weight the cost of equity and the after-tax cost of debt by each source's share of total capital.
WACC = (E/V × Re) + (D/V × Rd × (1 − T))The five inputs you need: a risk-free rate (10-year Treasury), an equity beta, an equity risk premium (ERP), a pre-tax cost of debt, and the company's effective tax rate. Get any one of these wrong, and your discount rate — and the valuation it drives — shifts materially.
Every serious valuation starts with one question: what rate should I use to discount future cash flows back to today? The answer is almost always the Weighted Average Cost of Capital — WACC. Get it wrong by even 100 basis points, and a $500 million enterprise value estimate can swing by $40 to $80 million.
This guide walks through exactly how to calculate WACC from scratch, with a full numerical example using Apple Inc.'s FY2023 reported financials.
Put This Theory into Practice
Determine risk-adjusted discount rates with market weights, CAPM equity cost, and tax-shielded debt. Enter your custom inputs and simulate scenarios in our math-verified WACC Calculator.
Understanding the WACC Formula: Components and Data Sources

WACC represents the blended required return of everyone who has a financial claim on the business — equity holders and debt holders combined. The critical insight is that debt is cheaper than equity (because interest is tax-deductible and debt holders accept less risk), so the capital mix matters enormously.
The Core WACC Formula and What Each Variable Represents
The standard WACC formula is:
WACC = (E/V × Re) + (D/V × Rd × (1 - T))
Breaking down each variable:
E = Market value of equity (shares outstanding × current share price)
D = Market value of debt (total interest-bearing debt at market value, often approximated by book value for investment-grade issuers)
V = E + D (total firm value; the capital base)
E/V = Equity weight in the capital structure
D/V = Debt weight in the capital structure
Re = Cost of equity (typically derived from the Capital Asset Pricing Model, CAPM)
Rd = Pre-tax cost of debt (yield to maturity on outstanding bonds, or weighted average interest rate)
T = Effective corporate tax rate (use the marginal rate for forward-looking models, or the effective rate from the income statement for historical analysis)
The (1 - T) multiplier on debt cost is the tax shield — interest payments reduce taxable income, making debt effectively cheaper on an after-tax basis. For a company facing a 21% federal tax rate, a 5% interest rate becomes an effective 3.95% cost after the shield is applied.
The table below shows the standard input set, where to source each figure, and the illustrative values used in the Apple FY2023 case study that follows:
Input | Source | Example (Apple FY2023) |
|---|---|---|
Risk-free rate (Rf) | 10-year U.S. Treasury / FRED | 4.30% |
Levered beta (βL) | Damodaran industry table, re-levered | 1.24 |
Equity risk premium (ERP) | Damodaran implied ERP | 5.00% |
Pre-tax cost of debt (Rd) | 10-K notes / bond YTM | 2.99% |
Effective tax rate (T) | Income statement | 14.7% |
Total debt (D) | Balance sheet | $111.0B |
Market cap (E) | Shares × closing price | $2,994B |
Common WACC Modeling Mistakes That Distort Your Valuation
Even analysts who know the formula routinely produce unreliable WACC figures by sourcing or applying inputs incorrectly. These are the five errors that appear most often in practice:
Using book value equity instead of market value equity. Book value is an accounting artifact. Market capitalization — shares outstanding multiplied by current price — is the economically correct equity weight. Using book equity in a levered tech company can understate E/V by 80% or more, artificially inflating the role of cheap debt and collapsing WACC below its true level.
Using the 3-month T-bill rate as the risk-free rate. For any DCF model with a multi-year projection horizon, the risk-free rate must match the duration of the cash flows. The 10-year U.S. Treasury yield is the standard. Using short-term rates inflates the equity risk premium and produces a structurally inconsistent WACC.
Copying a 5-year regression beta without adjusting for capital structure changes. Raw regression betas embed whatever D/E ratio prevailed during the lookback window. If the company deleveraged or took on significant debt in that period, the beta is stale. Always unlevered the observed beta and re-lever to the current (or target) capital structure.
Mixing historical and forward-looking tax rates. Use the effective tax rate from the most recent full fiscal year income statement for historical case studies, or the statutory marginal rate for forward-looking models — never blend both in the same calculation.
Ignoring operating lease debt. Post-IFRS 16 and ASC 842, capitalized operating leases appear on the balance sheet as right-of-use assets and corresponding liabilities. These are interest-bearing obligations and must be included in total debt (D) for a complete WACC calculation.
Where to Source Each Input: Risk-Free Rate, Beta, and ERP
This is where most analyst errors originate. Sloppy input sourcing produces a WACC figure that looks precise but carries hidden estimation risk.
Risk-Free Rate (Rf): Use the yield on the 10-year U.S. Treasury note, sourced directly from the Federal Reserve Economic Data (FRED) database. As of mid-2026, the 10-year Treasury yield is approximately 4.3%. Never use the 3-month T-bill rate for a long-duration valuation — the duration mismatch inflates your equity premium estimate.
Equity Risk Premium (ERP): Use Professor Aswath Damodaran's annually updated implied ERP dataset, published on his NYU Stern data page. The implied ERP for the U.S. market in 2026 is approximately 5.0–5.2%. Avoid using historical realized premium averages — they are backward-looking and structurally biased.
Beta (β): Source the equity beta from Damodaran's industry-level unlevered beta tables, then re-lever for the company's target capital structure using the Hamada equation:
βL = βU × [1 + (1 - T) × (D/E)]. Do not blindly copy the 5-year monthly regression beta from a financial data terminal without checking for capital structure changes in the period.Cost of Debt (Rd): Pull the weighted average yield-to-maturity from the company's most recent 10-K filing on SEC EDGAR. For private companies, use the synthetic rating approach (interest coverage ratio → S&P rating → default spread from Damodaran's table) to estimate a fair pre-tax cost of debt.
💡 Ready to skip the setup? Enter your capital structure, CAPM inputs, and tax rate directly into our WACC Calculator — it handles the formula mechanics and outputs an institutional-grade WACC with a sensitivity table in under 60 seconds.
Apple Inc. FY2023 WACC Calculation: A Real-World Case Study

This case study uses Apple Inc. FY2023 financial disclosures and market assumptions available around the FY2023 valuation date. All inputs — risk-free rate, beta, ERP, debt figures, and tax rate — are sourced from that same period. This is an educational modeling example built on illustrative assumptions; it is not a current investment recommendation or Apple's official WACC.
To make this concrete, here is a complete WACC calculation for Apple Inc. using FY2023 reported data. Apple makes a useful benchmark because it is investment-grade, widely covered, and its financials are clean and well-disclosed.
Quick WACC Example: The 30-Second Version
Before working through Apple's full financials, here is the simplest possible WACC to build intuition. Assume a hypothetical company with:
Equity weight (E/V): 70%
Debt weight (D/V): 30%
Cost of equity (Re): 10.0%
Pre-tax cost of debt (Rd): 6.0%
Effective tax rate (T): 25%
WACC = (70% × 10.0%) + (30% × 6.0% × (1 − 25%)) WACC = 7.00% + 1.35% = 8.35%
This company's blended cost of capital is 8.35%. Any project generating a return above 8.35% creates value; any project below that threshold destroys it. That is the core purpose of WACC in capital allocation decisions. Now apply the same logic to a real company.
Step-by-Step: Computing Cost of Equity with CAPM
The cost of equity uses the Capital Asset Pricing Model:
Re = Rf + βL × (ERP)
Inputs for Apple FY2023:
Risk-Free Rate (Rf): 4.30% (10-year U.S. Treasury yield, mid-2023 average sourced from FRED)
Levered Beta (βL): 1.24 (Damodaran's Technology sector equity beta, re-levered to Apple's D/E of ~0.16)
Equity Risk Premium (ERP): 5.00% (Damodaran implied ERP, January 2023 estimate)
Calculation:
Re = 4.30% + 1.24 × 5.00% = 4.30% + 6.20% = 10.50%
Apple's cost of equity is approximately 10.5%. This reflects the systematic market risk embedded in Apple's business — hardware concentration, regulatory exposure, and premium consumer brand dependency.
Step-by-Step: After-Tax Cost of Debt and Capital Structure Weights
Inputs for Apple FY2023 (sourced from 10-K):
Total debt (D): $111.0 billion (long-term debt + current portion)
Market cap (E): $2,994 billion (shares outstanding × closing price, Sep 2023)
Pre-tax cost of debt (Rd): 2.99% (disclosed weighted average interest rate in 10-K notes)
Effective tax rate (T): 14.7% (from Apple's FY2023 income statement)
Capital structure weights:
V = E + D = $2,994B + $111B = $3,105B
E/V = 2,994 / 3,105 = 96.4%
D/V = 111 / 3,105 = 3.6%
After-tax cost of debt:
Rd × (1 - T) = 2.99% × (1 - 0.147) = 2.99% × 0.853 = 2.55%
WACC Final Calculation:
WACC = (0.964 × 10.50%) + (0.036 × 2.55%) WACC = 10.12% + 0.09% = 10.22%
Apple's WACC for FY2023 modeling purposes is approximately 10.2% under these specific illustrative assumptions. Different beta sources, ERP methodologies, or lease-debt treatment can shift this figure. Third-party estimates of Apple's discount rate during the same period ranged from 8% to 10.5% — the spread reflects exactly the input sensitivity documented in the Common Mistakes section above.
Sensitivity observation: If you shift the equity risk premium from 5.0% to 5.5%, Re increases to 11.1%, and WACC moves to approximately 10.8% — a 60-basis-point swing that reduces a $3 trillion intrinsic value estimate by roughly $150–200 billion at the DCF level.
How WACC Feeds Into Your DCF Model and Capital Budgeting Decisions

WACC is not a standalone calculation — it is the input that drives everything downstream in a discounted cash flow model. Once you have your WACC, you use it as the discount rate to convert projected free cash flows (FCFF) into a present value, and then apply it again in your terminal value calculation.
WACC as the Discount Rate: Sensitivity to Small Input Changes
The most dangerous mistake in valuation practice is treating WACC as a fixed number. In a mature DCF Calculator model, you should always stress-test at minimum three WACC scenarios:
Bear case: WACC + 1.5% (higher market risk premium, rising rates environment)
Base case: Calculated WACC (your best-estimate inputs)
Bull case: WACC − 1.0% (credit rating upgrade, lower beta due to business mix shift)
The resulting sensitivity grid will often show a 2.5× range in implied enterprise value across these three scenarios — a reminder that WACC uncertainty is the dominant source of DCF model variance, not the revenue forecast.
For capital budgeting decisions, WACC serves as the hurdle rate: any project with an IRR above WACC creates shareholder value; any project below destroys it. Use our IRR Calculator in conjunction with the WACC you compute here to evaluate individual investment decisions side by side.
For projects with non-periodic cash flows, the NPV Calculator gives you the direct dollar-value wealth creation estimate at your chosen discount rate.
One frequently overlooked point: WACC should be re-estimated any time the capital structure changes materially (e.g., a leveraged buyout, a major debt paydown, or a significant equity issuance). Using a stale WACC from two years prior for a company that has shifted from 15% debt to 45% debt will produce a structurally incorrect valuation.
Running Institutional-Grade WACC Analysis with BizToolkitPro
The manual calculations above are educational, but building and maintaining a WACC model in Excel carries meaningful operational risk. Formula errors, hardcoded inputs, and version-control failures are the most common sources of valuation mistakes in practice.
Our WACC Calculator was built to eliminate these failure modes:
CAPM module: Enter your risk-free rate, beta, and equity risk premium — the tool computes Re automatically and shows the CAPM decomposition.
Capital structure inputs: Input equity market cap and total debt; the tool computes E/V and D/V weights in real time.
After-tax debt cost: Specify pre-tax Rd and your effective tax rate; the tax shield adjustment is applied automatically.
Sensitivity matrix: The calculator outputs a 5×5 WACC grid across two user-selected variables (e.g., beta vs. ERP, or tax rate vs. Rd), showing how WACC shifts under different assumptions.
PDF export: Download a board-ready one-page WACC memo with your inputs, formula walkthrough, and the sensitivity matrix — suitable for investment committee presentations.
Example WACC Calculator Output
Output | What It Shows |
|---|---|
Cost of equity (Re) | CAPM result: Rf + β × ERP |
After-tax cost of debt | Pre-tax Rd × (1 − T), the tax-shielded debt cost |
Equity weight (E/V) | Market cap as a share of total capital |
Debt weight (D/V) | Total debt as a share of total capital |
Final WACC | Blended discount rate for DCF and hurdle-rate decisions |
Sensitivity table | WACC grid across two user-defined input variables |
Put This Into Practice: Stop rebuilding this WACC calculation every time you start a new deal. Use our WACC Calculator to run your full capital structure analysis in under two minutes — with an exportable PDF memo and 2D sensitivity matrix ready for your next board deck.
Frequently Asked Questions
What is a typical WACC range for US public companies?
WACC varies significantly by industry, capital structure, and the prevailing interest rate environment. As a general benchmark using 2026 market conditions (10-year Treasury at ~4.3%, implied ERP of ~5.0%):
Technology (large cap): 9.0%–11.5% (high beta, equity-heavy balance sheets)
Consumer staples: 6.5%–8.5% (lower beta, moderate debt use)
Utilities: 5.5%–7.5% (regulated revenue, high leverage, low beta)
Real estate (REITs): 7.0%–9.0% (interest-rate sensitive, significant debt)
Healthcare / biotech: 8.0%–13.0% (wide range driven by pipeline risk and profitability stage)
These benchmarks are derived from Damodaran's 2026 industry-level WACC dataset. A well-calculated company-specific WACC should fall within ±200 basis points of its sector median; a larger deviation typically signals a modeling input that deserves scrutiny.
Should I use book value or market value weights in WACC?
Always use market value weights. This is the academically correct approach and the one mandated by the CFA Institute curriculum and standard corporate finance textbooks.
Book value weights are accounting artifacts that reflect historical capital raises at historical prices — they bear no relationship to the economic value that equity and debt holders can currently claim. Market value weights reflect what equity holders and debt holders are actually owed today, which is the correct basis for computing a blended required return.
The only practical exception: if you are building a private company WACC where no market price for equity is observable, you may use a "target" capital structure (the ratio the company would maintain if it were public with an investment-grade rating) as a proxy for market value weights.
How often should I recalculate WACC for an ongoing DCF model?
In buy-side practice, WACC should be refreshed at minimum once per year, and more frequently under these triggers:
Material capital structure change: A large debt raise, equity secondary offering, or significant buyback that shifts D/E by more than 5 percentage points.
Credit rating change: A ratings upgrade or downgrade changes the default spread embedded in your cost of debt.
Interest rate regime shift: A 75+ basis point move in the 10-year Treasury changes both the risk-free rate and market risk premium simultaneously.
Beta recalibration: Industry structural changes (e.g., sector rotation, regulatory disruption) that shift the systematic risk profile of the business.
For most long-term valuation models, reviewing WACC annually alongside the annual report cycle is sufficient.
Is WACC the same as the discount rate in a DCF model?
For an unlevered DCF model (projecting free cash flow to the firm, FCFF), yes — WACC is the correct discount rate. It reflects the blended required return of all capital providers, which matches the cash flow definition that excludes financing costs.
For a levered DCF (projecting free cash flow to equity, FCFE), you would use the cost of equity (Re) alone as the discount rate — not WACC. Applying WACC to FCFE double-counts the tax shield benefit and produces an inflated equity value. The choice of cash flow definition and discount rate must always be internally consistent.
What is the difference between WACC and IRR?
WACC and IRR answer different questions. WACC is the required rate of return — the minimum return the business must generate to satisfy all capital providers. IRR is the realized or projected rate of return on a specific investment or project — the discount rate that makes the NPV of that investment equal to zero.
The decision rule: if a project's IRR exceeds the company's WACC, the investment creates value (positive NPV). If IRR falls below WACC, the project destroys capital. Use our IRR Calculator alongside the WACC you calculate here to apply this test to any proposed capital expenditure or acquisition.
Can WACC be used for private companies and early-stage startups?
WACC can be adapted for private companies, but with important modifications. The core challenge is that private companies have no observable market capitalization (for equity weighting) and no market-traded beta (for CAPM). Practitioners typically use two workarounds:
Comparable public company beta: Identify a set of publicly traded peers, unlever their betas, average the unlevered betas, then re-lever to the private company's capital structure.
Target capital structure: Use an industry-typical D/E ratio as a proxy for market value weights, since book equity is not a reliable substitute.
For early-stage startups with no earnings and uncertain cash flows, WACC becomes less reliable as a discount rate. Venture capital methodology (target IRR-based hurdle rates of 25–40%) or scenario-weighted probability-adjusted DCF models are generally more appropriate tools at that stage.
Put This Theory Into Practice
Run your own scenario analysis with our math-verified calculators.