WACC by Industry: 2026 Benchmarks for Technology, Healthcare, and Real Estate
In 2026, industry WACC diverges sharply, from 5.5% for utilities to over 11.5% for software. CFOs must benchmark their discount rate against peers to ground valuations in market reality.
2026 Industry WACC Benchmarks Explained
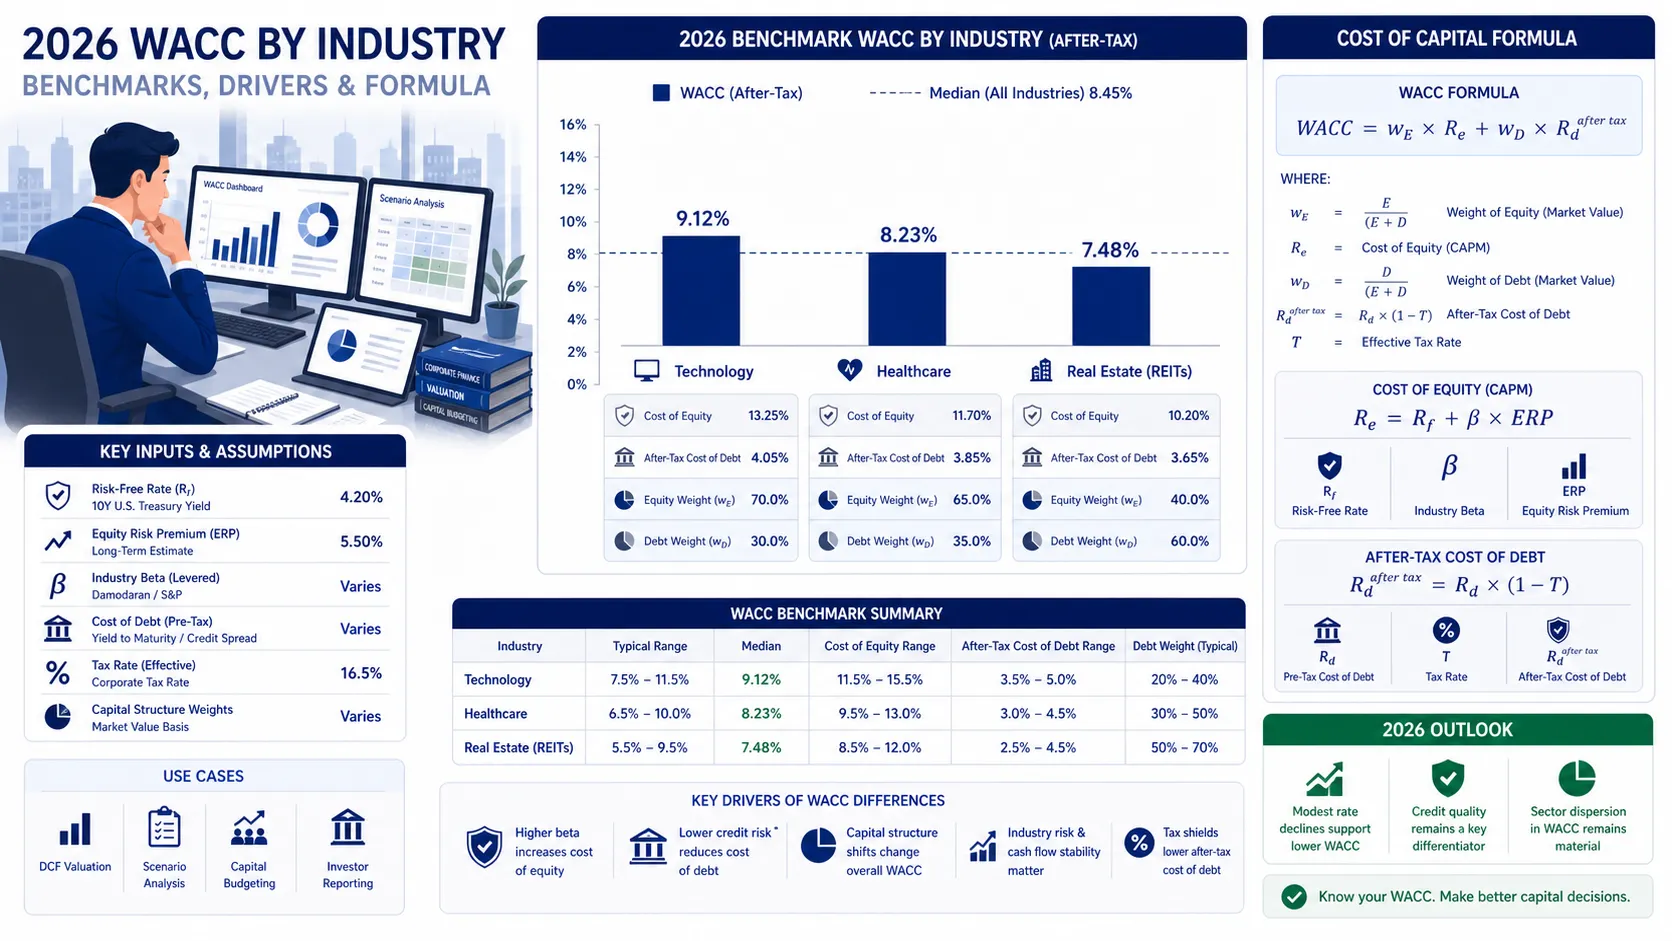
WACC = (E/V × Re) + [D/V × Rd × (1 - T)]In 2026, the average corporate Weighted Average Cost of Capital (WACC) spans from roughly 5.5% for utilities to over 11.5% for high-growth software. Capital-intensive industries like Real Estate rely heavily on cheap, tax-shielded debt, driving their WACC lower (typically 6.5% - 8.5%).
Conversely, asset-light Technology firms rely almost entirely on expensive equity, pushing their WACC higher (8.5% - 11.0%).
When valuing a business, analysts rarely build a Discounted Cash Flow (DCF) model in a vacuum. A company's discount rate must be cross-referenced against its peer group to ensure the valuation is grounded in market reality. Analyzing WACC by industry in 2026 reveals how macroeconomic interest rates interact differently with distinct business models, from heavy-asset manufacturing to pure intellectual property software.
1. Understanding Sector-Specific Capital Structures
Put This Theory into Practice
Determine risk-adjusted discount rates with market weights, CAPM equity cost, and tax-shielded debt. Enter your custom inputs and simulate scenarios in our math-verified WACC Calculator.
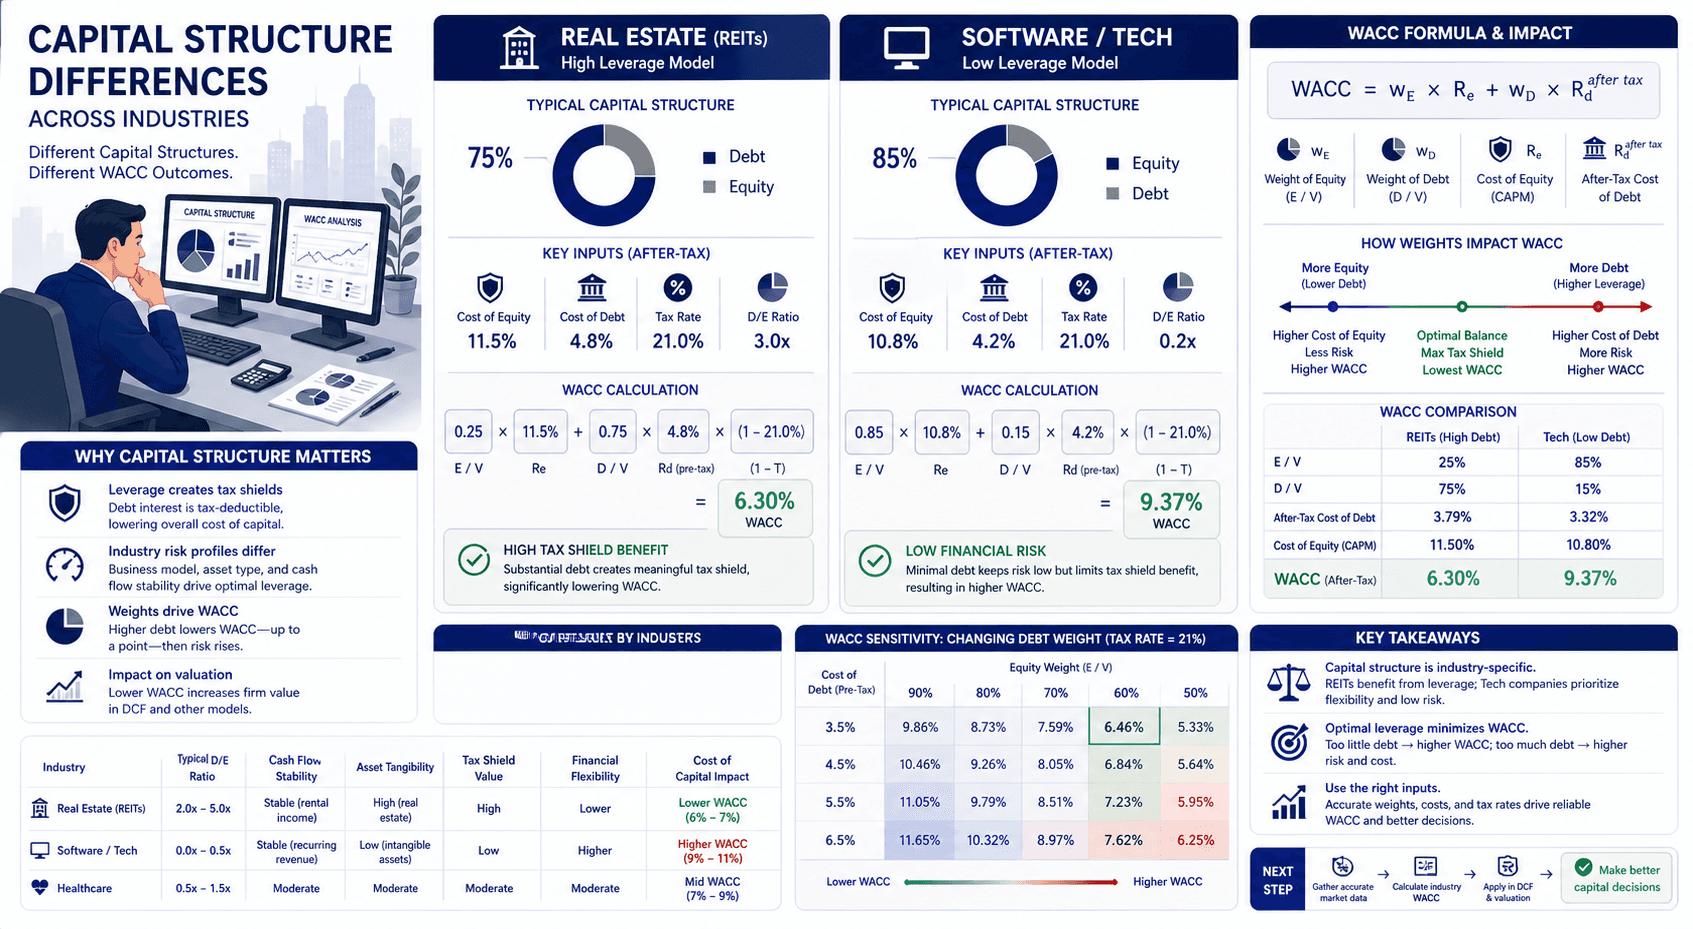
A company's WACC is not purely a reflection of its individual operational success; it is heavily dictated by the structural norms of its industry. The two primary drivers of industry variance are the reliance on debt (capital structure) and the inherent volatility of the revenue stream (Equity Beta).
How Industry Risk Drives WACC Formula Variables
To understand why a hospital has a different hurdle rate than an AI startup, we must look at the standard inputs across sectors in 2026:
Industry Input | Source / Metric | Example Impact (FY2026) |
|---|---|---|
Levered Beta | Measures revenue volatility | Consumer Staples (0.7) vs. Biotech (1.5) |
Debt / Equity Ratio | Measures leverage capacity | REITs (50% Debt) vs. SaaS (5% Debt) |
Cost of Debt | Measures default risk | Utilities (AAA yield) vs. Tech (High Yield) |
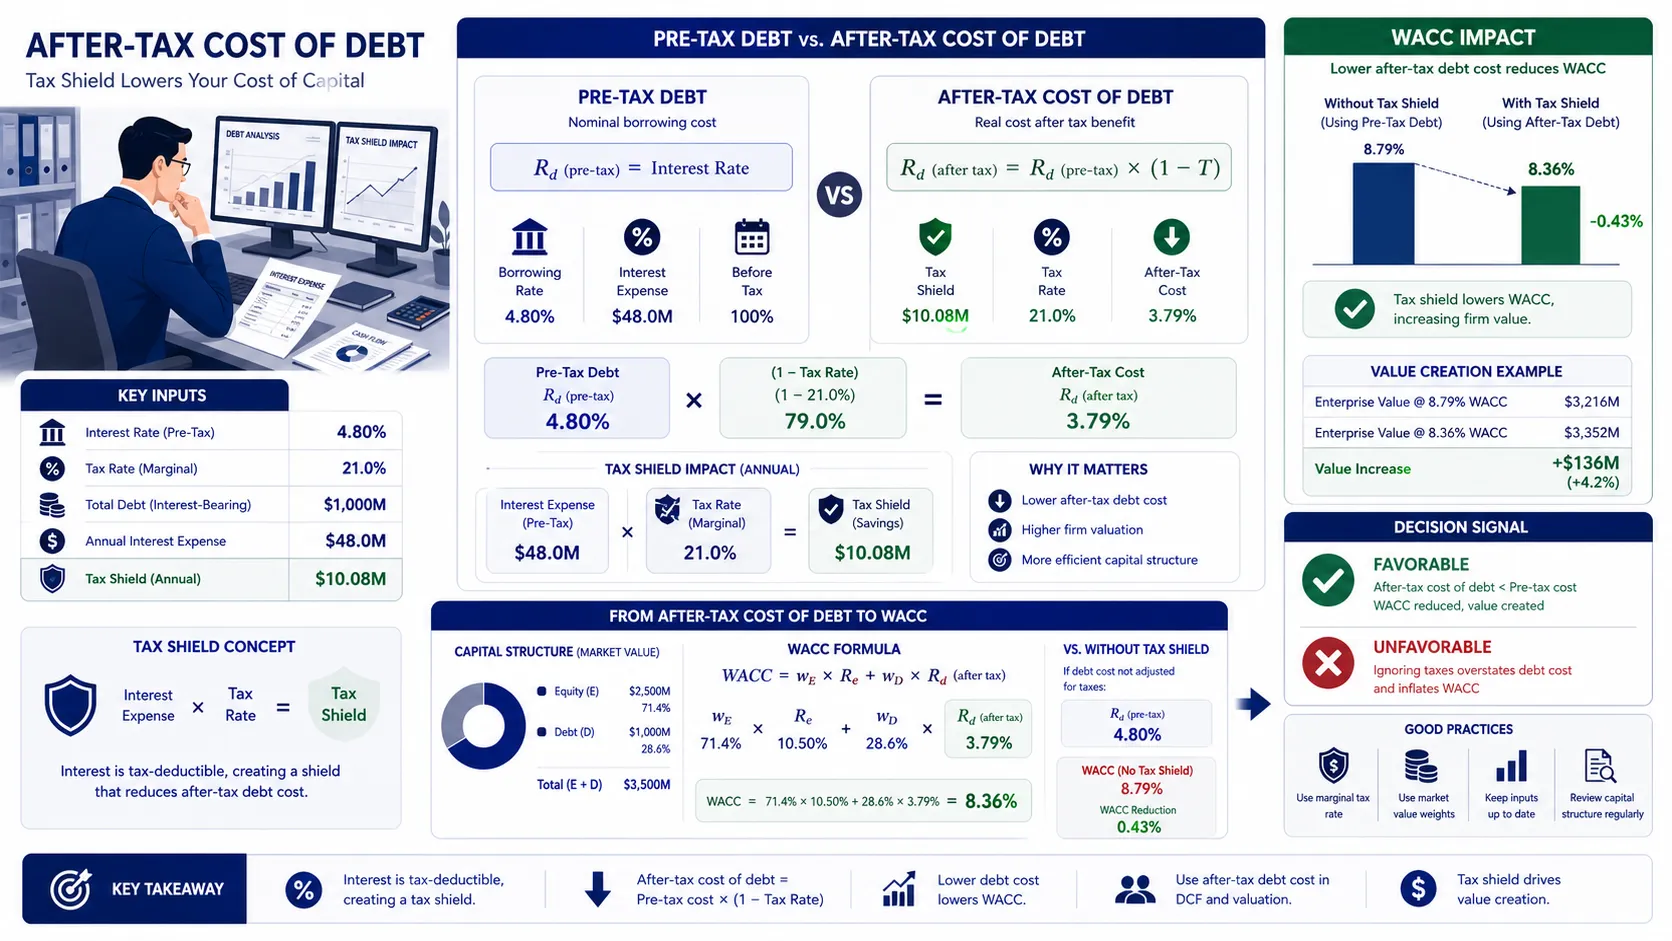
Because debt is cheaper than equity and offers a tax shield, industries with hard, tangible assets that can be used as collateral (like Real Estate or Utilities) can safely borrow massive amounts of money. This structurally lowers their WACC.
Common Industry Benchmarking Mistakes
When using industry averages to inform your models, beware of these critical errors:
Using Broad Categorizations: Assuming "Technology" is a single sector. A mature hardware manufacturer like Cisco has a radically different capital structure and WACC than a pre-IPO generative AI startup.
Applying Global Averages to Regional Models: The U.S. Equity Risk Premium and Risk-Free Rate differ significantly from those in emerging markets. Applying a U.S. industry WACC to a Latin American telecom company will severely overvalue the asset.
Ignoring Transitory Shocks: If the healthcare sector experiences a temporary regulatory shock that spikes its Beta in 2026, applying that spiked WACC to a 10-year DCF will unfairly penalize long-term value.
Blindly Adopting Averages for DCFs: An industry average WACC is a sanity check, not an input. You must always calculate a company-specific WACC based on its actual capital structure.
Data Sources: Damodaran's 2026 Industry Averages
For institutional baselines, analysts rely on Damodaran’s NYU Stern Datasets, which provide aggregate Levered Betas, Debt-to-Equity ratios, and effective tax rates for nearly 100 sub-sectors. These data sets are updated annually, ensuring that 2026 macroeconomic shifts (such as interest rate normalization) are fully captured in the baseline WACC metrics.
💡 Pro Tip: If you already know your industry's average Beta and D/E ratio, you can calculate the exact WACC instantly. Use our WACC Calculator to see how shifting your capital structure closer to the industry median affects your discount rate.
2. Deep Case Study: 2026 WACC Analysis Across Three Sectors
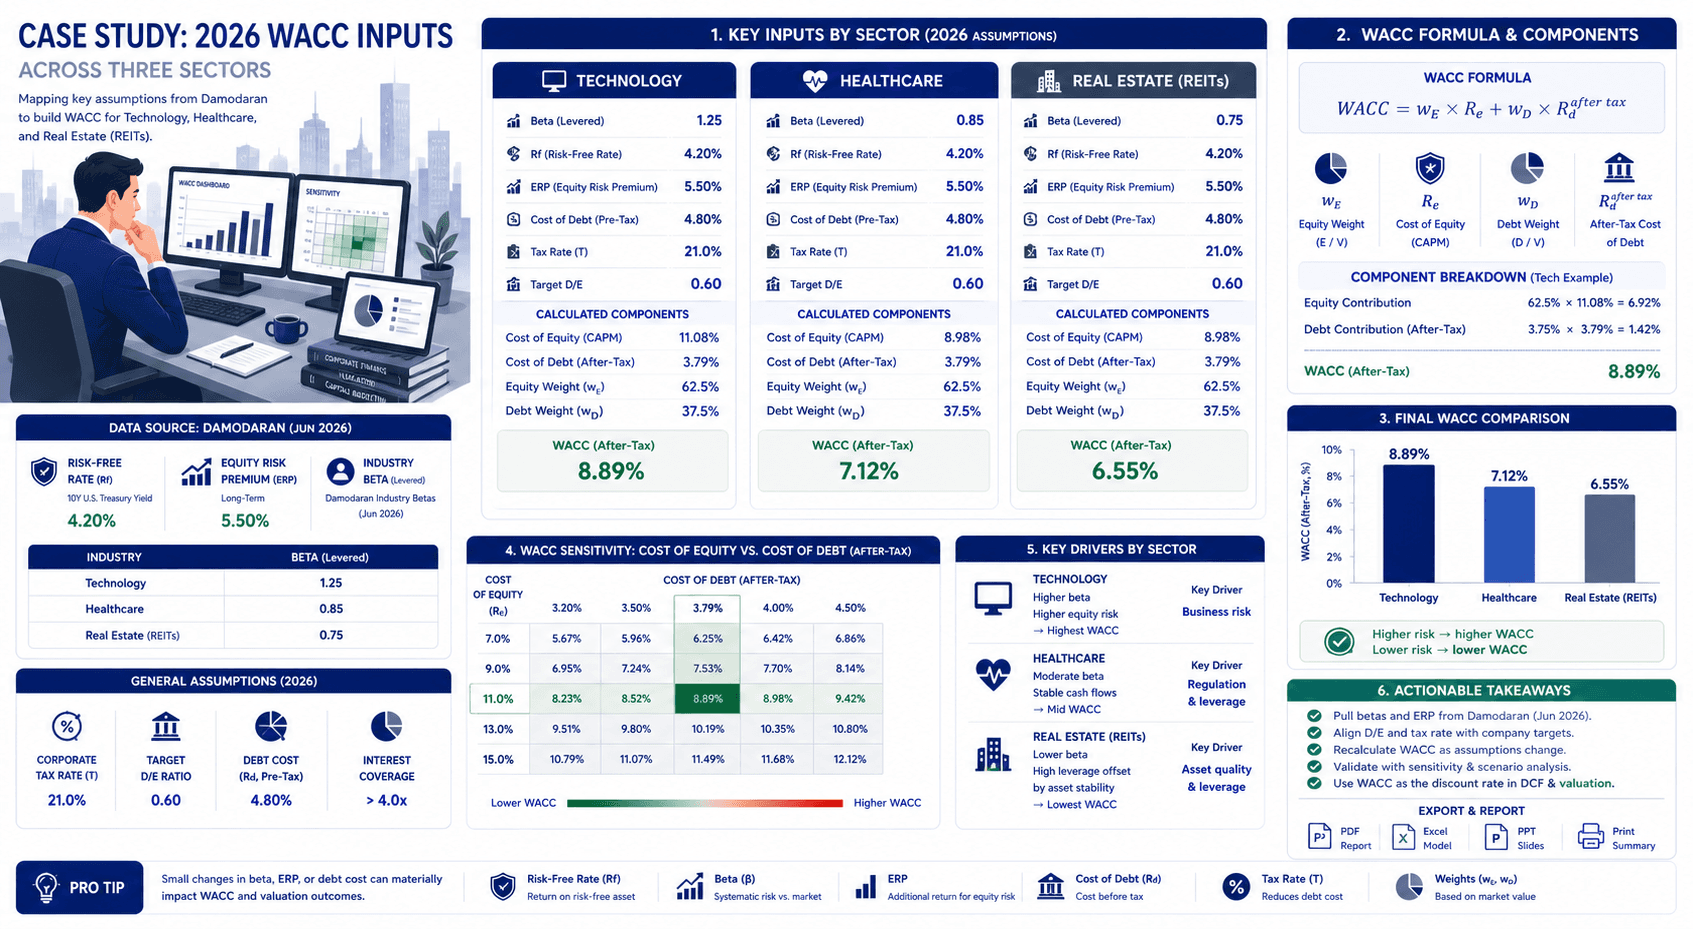
This case study uses illustrative, aggregated industry metrics appropriate for a FY2026 valuation date to demonstrate sector divergence. It is an educational modeling example.
To illustrate how the WACC formula behaves dynamically, we will construct a comparative analysis across three distinct sectors: Technology (Software), Healthcare (Hospitals), and Real Estate (Commercial REITs). We will assume a uniform 2026 Risk-Free Rate of 4.3% and an Equity Risk Premium of 5.0%.
Quick Industry WACC Example: The 30-Second Version
Tech (High Equity, High Risk): 95% Equity weight × 11% Cost of Equity = ~10.5% WACC.
Real Estate (High Debt, Low Risk): 50% Equity (at 8% cost) + 50% Debt (at 4% after-tax cost) = ~6.0% WACC.
Conclusion: Future cash flows in Tech are discounted almost twice as heavily as cash flows in Real Estate.
Deconstructing the Software/Tech Premium
Let's look at the "Software (System & Application)" sub-sector. In 2026, software companies are characterized by high growth, intangible assets (code/IP), and virtually zero debt.
Capital Structure: 90% Equity ($E/V$), 10% Debt ($D/V$)
Levered Beta: 1.25 (High volatility)
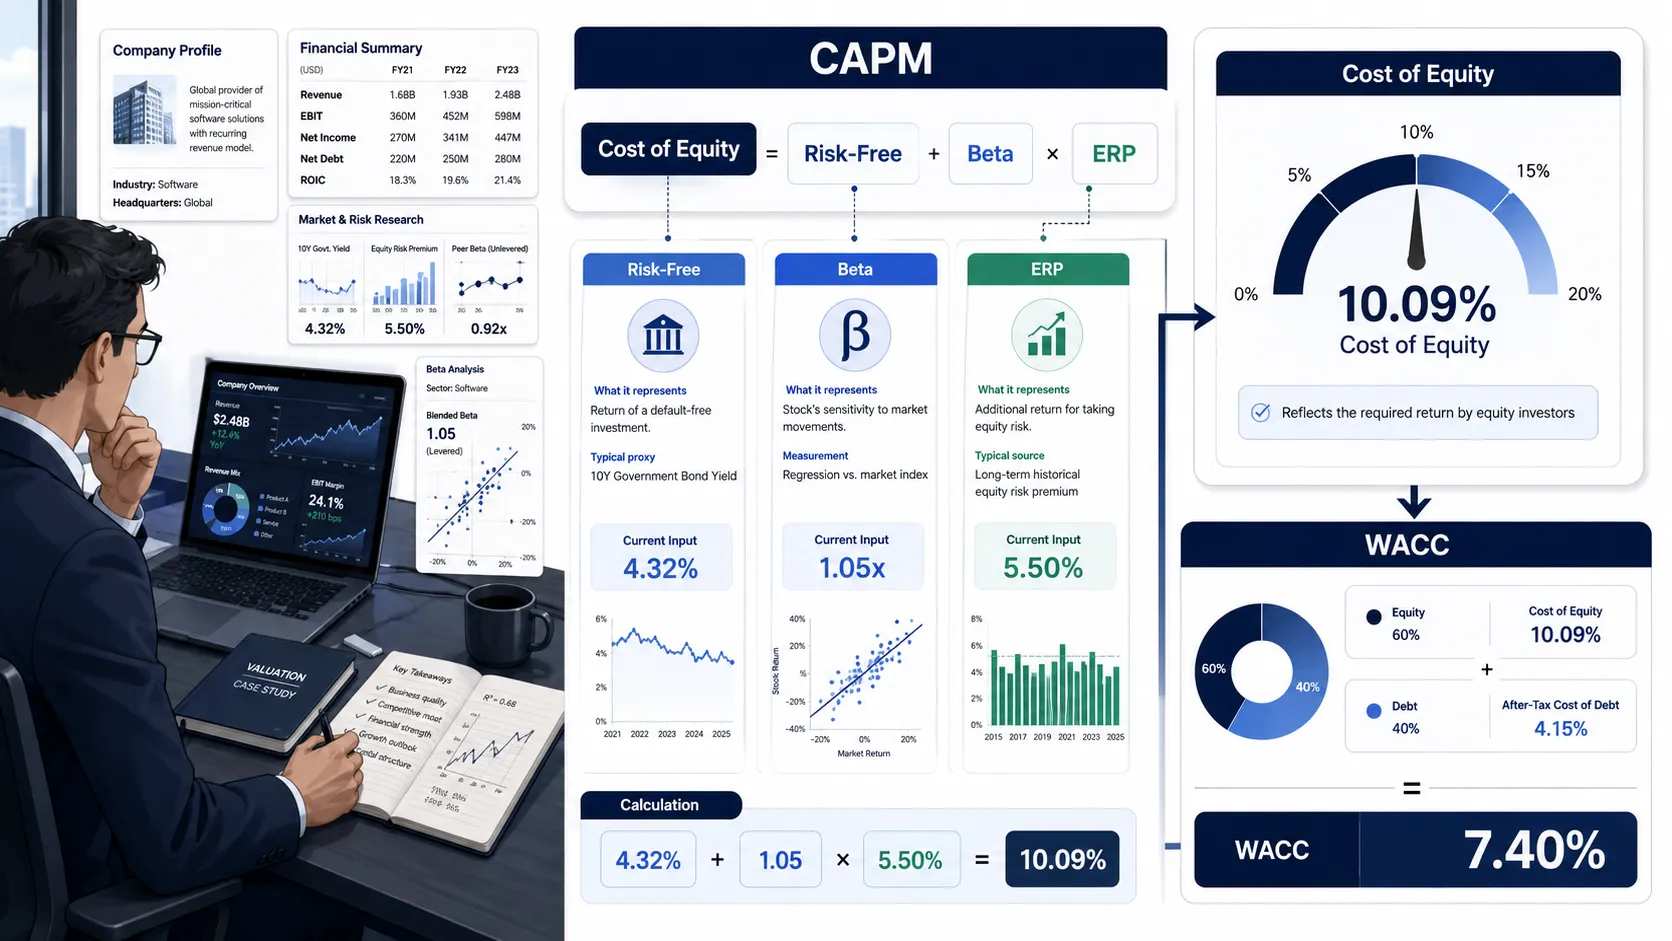
Cost of Equity (CAPM):
4.3% + (1.25 × 5.0%) = 10.55%After-Tax Cost of Debt: 5.0%
Final Tech WACC:
(0.90 × 10.55%) + (0.10 × 5.0%) = 9.50% + 0.50% = 10.00%
Because software companies cannot use their code as collateral for massive bank loans, they miss out on the debt tax shield. Their WACC is almost entirely driven by their expensive Cost of Equity.
The Heavy Leverage Advantage in Real Estate
Conversely, consider a Commercial Real Estate Investment Trust (REIT). Their assets are physical buildings with predictable, contracted lease cash flows, allowing them to safely carry massive debt.
Capital Structure: 50% Equity ($E/V$), 50% Debt ($D/V$)
Levered Beta: 0.80 (Lower volatility due to stable rent)
Cost of Equity (CAPM):
4.3% + (0.80 × 5.0%) = 8.30%After-Tax Cost of Debt: 4.0%
Final REIT WACC:
(0.50 × 8.30%) + (0.50 × 4.0%) = 4.15% + 2.00% = 6.15%
The REIT's WACC (6.15%) is significantly lower than the Software company's WACC (10.00%). The REIT utilizes 50% cheap debt, and its equity investors demand a lower return due to the safety of the underlying hard assets.
3. How to Benchmark Your WACC with BizToolkitPro
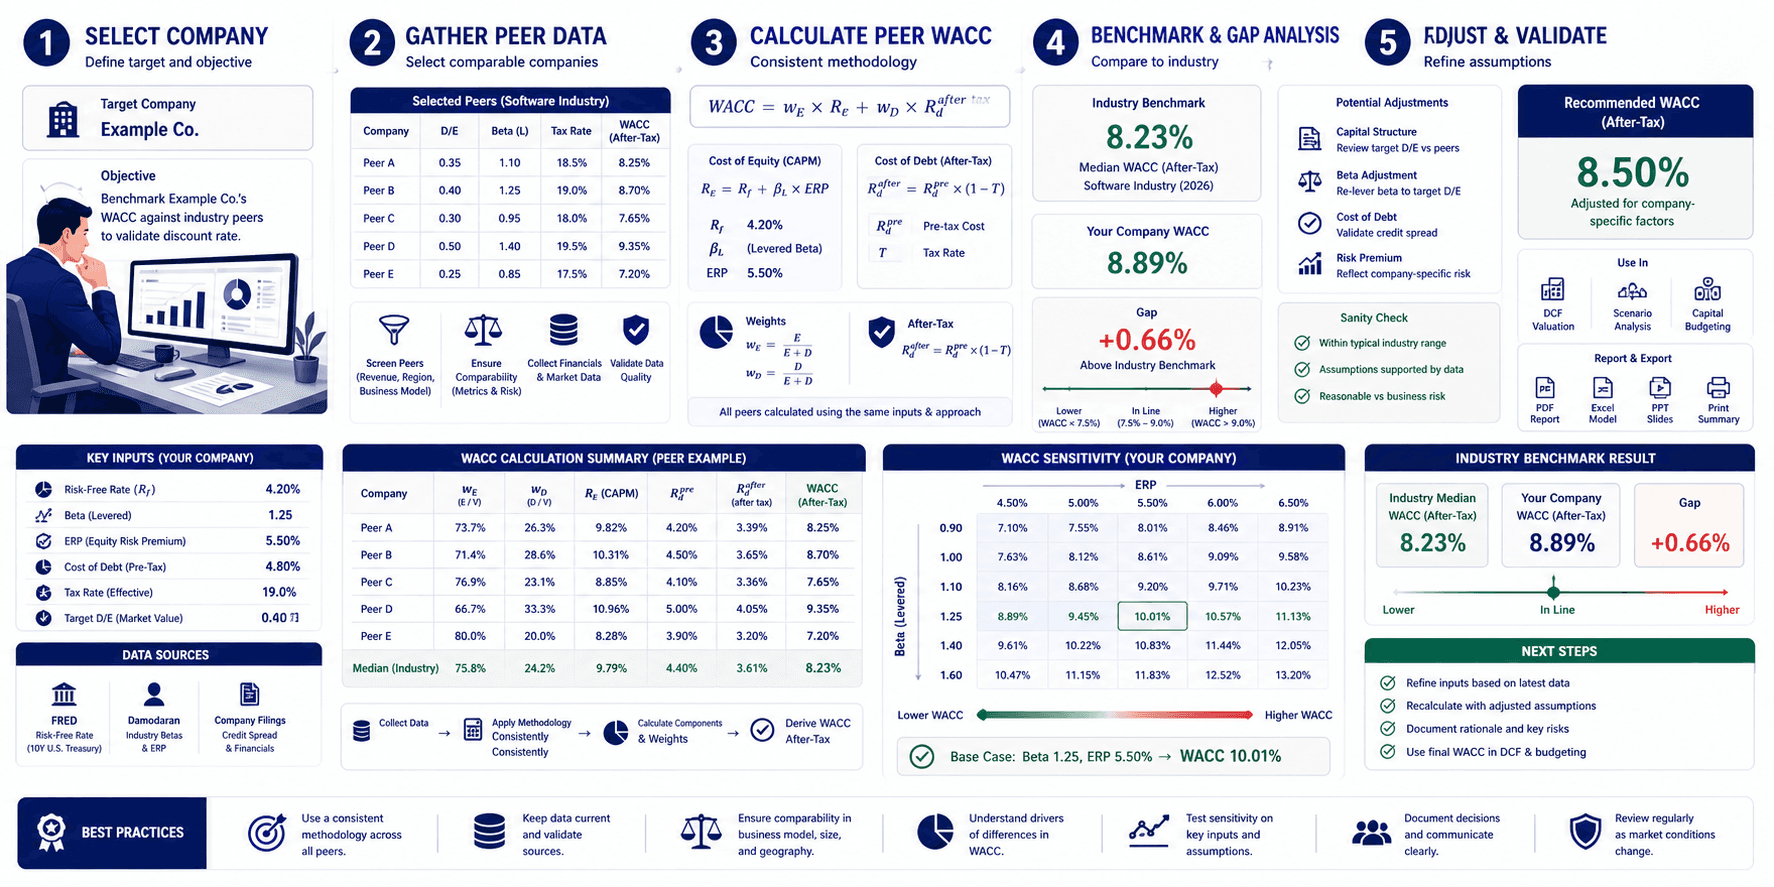
When building a valuation model, your specific target company will inevitably diverge slightly from the broad industry average. Our tools help you contextualize this deviation.
Customizing Baseline Inputs for Your Sector
You can start by pulling the Damodaran industry average Beta and plugging it into the BizToolkitPro valuation engine. From there, adjust the Debt-to-Equity slider to match your specific company's balance sheet. If your company carries more debt than the industry average, the calculator will instantly show how your WACC drops below the peer benchmark.
Example WACC Calculator Output Explained
Example WACC Calculator Output | What It Shows |
|---|---|
Custom Cost of Equity (CAPM) | The specific return demanded for your company's risk profile |
Custom After-Tax Cost of Debt | Your company's actual borrowing cost, net of taxes |
Implied WACC | Your customized discount rate |
Industry Median Delta | Visually displays if your WACC is higher or lower than the sector |
Sensitivity Matrix | Shows how your valuation shifts if your industry's Beta changes |
Put This Into Practice: Stop guessing your discount rates. Run your industry-specific scenarios now with our WACC Calculator to lock in your baseline. Once you have your sector-accurate WACC, plug it directly into our DCF Calculator to see the massive impact on Enterprise Value.
Frequently Asked Questions
Which industry has the lowest WACC in 2026?
Historically, and continuing into 2026, the Utilities (Water, Gas, Electric) and Infrastructure sectors maintain the lowest WACC. Their revenues are legally regulated monopolies, making their cash flows incredibly safe (low Beta). This extreme safety allows them to carry debt loads exceeding 50% of their capital structure, heavily utilizing the cheap debt tax shield.
Which industry has the highest WACC?
Biotechnology, early-stage SaaS, and speculative precious metals mining typically have the highest WACCs. These industries face binary outcomes (e.g., a drug passes FDA trials or fails completely), resulting in massive Equity Betas. Furthermore, because their cash flows are negative or unpredictable, they cannot secure cheap debt, forcing them to rely on 100% expensive equity.
Why is a tech startup's WACC higher than a mature bank's?
A tech startup relies entirely on venture capital (equity) and faces immense execution risk. Equity investors might demand a 15% to 20% return to compensate for the high probability of failure. A mature bank is highly regulated, inherently stable, and utilizes massive amounts of debt (deposits), allowing it to blend its capital cost down to the mid-single digits.
Do industry WACCs change every year?
Yes. Macroeconomic shifts drive constant WACC fluctuations. If the Federal Reserve raises the Risk-Free Rate, the WACC for every industry across the board increases. Furthermore, sector-specific shocks (like an AI boom for tech, or a commercial real estate crash for REITs) will alter industry Betas, shifting relative WACCs year over year.
How does inflation specifically affect the Real Estate WACC?
Inflation impacts Real Estate uniquely. While rising inflation drives up the Risk-Free Rate (increasing WACC and depressing valuations), commercial real estate leases often have CPI-linked escalators. This means their future cash flows grow alongside inflation, creating a natural hedge that partially offsets the valuation damage of the higher discount rate.
Can I use an industry average WACC for a DCF model?
As a rule of thumb, no. You should use a company-specific WACC. However, if you are valuing a private company with zero debt but the company intends to restructure its balance sheet post-acquisition to match the industry norm, using the industry average WACC is an acceptable modeling convention to estimate the "optimized" enterprise value.
Put This Theory Into Practice
Run your own scenario analysis with our math-verified calculators.