Terminal Growth Rate Changes: How They Impact DCF Valuation Models
A 0.5% shift in terminal growth rate can swing DCF valuation by 15%, as terminal value often drives over 70% of enterprise worth. CFOs must cap perpetuity growth at GDP or risk-free rates to avoid model distortions.
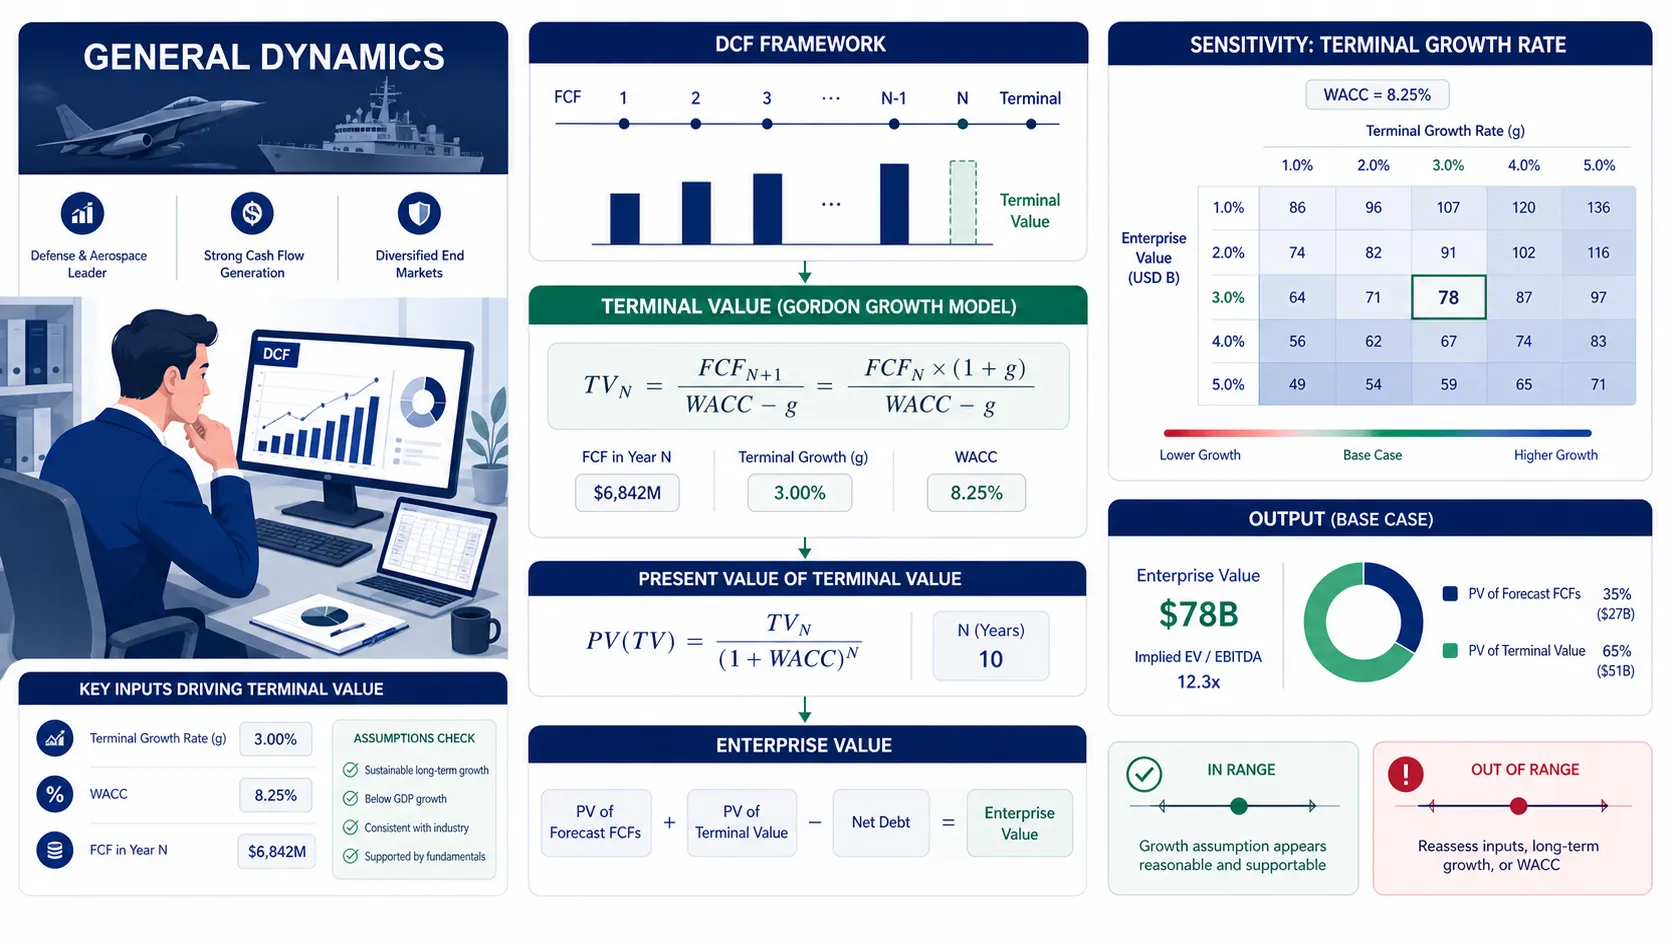
Terminal Growth Rate Impact Explained
Terminal Value = [FCF_n × (1 + g)] / (WACC - g)A minor 0.5% terminal growth assumption change can alter total enterprise value by 10% to 15%, because the terminal value often represents over 70% of a company's total DCF valuation. Always cap your perpetuity growth rate at or below the long-term macroeconomic GDP growth rate or risk-free rate to avoid mathematical impossibilities.
In institutional practice, adjusting a single basis point in the perpetuity growth rate can send shockwaves through a Discounted Cash Flow (DCF) model. Because the terminal value captures all future cash flows beyond the explicit forecast period—often five to ten years—it acts as the gravitational center of enterprise valuation.
Understanding how terminal growth assumption changes interact with the discount rate is arguably the most critical skill for financial analysts valuing mature businesses.
Put This Theory into Practice
Determine risk-adjusted discount rates with market weights, CAPM equity cost, and tax-shielded debt. Enter your custom inputs and simulate scenarios in our math-verified WACC Calculator.
1. Understanding the Terminal Growth Framework in Corporate Finance
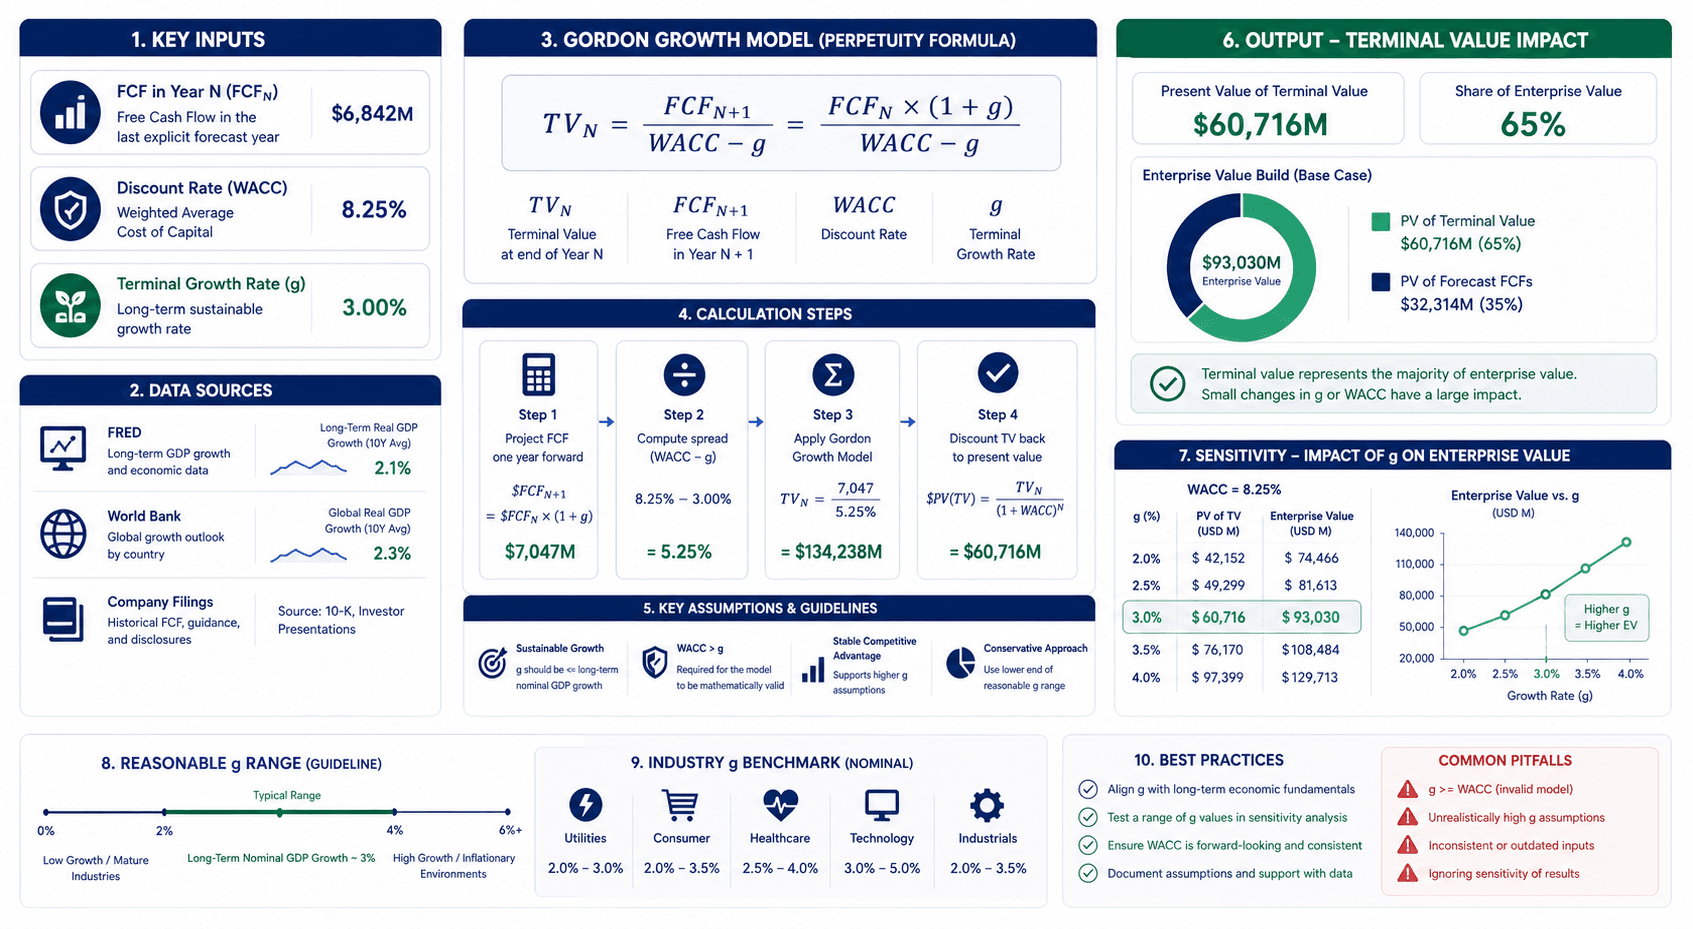
The Gordon Growth Model (GGM) assumes a company will grow its free cash flows at a constant, perpetual rate forever. While mathematically elegant, the infinite time horizon makes the formula extremely sensitive to the denominator spread between the Weighted Average Cost of Capital (WACC) and the growth rate ($g$).
The Gordon Growth Formula Breakdown and Key Inputs
The terminal value calculation relies on normalizing the final year's free cash flow and projecting it into perpetuity. The formula is:
TV = [FCF_n × (1 + g)] / (WACC - g)
To accurately drive this equation, analysts rely on three core pillars:
Input | Source | Example (FY2026) |
|---|---|---|
Terminal FCF ($FCF_n$) | Explicit forecast year 5 or 10 | $500M |
WACC | CAPM / Cost of debt schedules | 8.5% |
Perpetuity Growth Rate ($g$) | Long-term GDP / FRED 10-Year Treasury | 2.5% |
Common Terminal Value Modeling Mistakes
When building a DCF model, analysts typically encounter the following critical errors in terminal growth assumptions:
Violating the Macroeconomic Ceiling: Setting a terminal growth rate higher than the long-term GDP growth rate. No company can outgrow the broader economy forever; doing so mathematically implies the company will eventually consume the entire global economy.
Mismatched Inflation Expectations: Using a nominal WACC (which includes inflation) but pairing it with a real growth rate (excluding inflation), compressing the terminal value artificially.
Ignoring Capital Expenditure Normalization: Failing to set capital expenditures equal to depreciation in the terminal year. In perpetuity, a company cannot continually outspend depreciation without deteriorating returns on invested capital.
The Squeezed Denominator Risk: Pushing the terminal growth rate too close to the WACC. If WACC is 7% and growth is set to 6%, the denominator becomes 1%, causing the terminal value to hyper-inflate uncontrollably.
Selecting the Right Benchmark: GDP vs. Inflation
A robust terminal growth assumption anchors itself to macroeconomic realities. The U.S. 10-year Treasury yield is often used as a proxy for nominal economic growth because it embeds both expected inflation and real GDP growth expectations. In 2026, with inflation stabilizing, most institutional analysts cap terminal growth between 2.0% and 3.0% for mature, U.S.-centric corporations.
💡 Pro Tip: Ready to run this calculation instantly and test different sensitivities? Use our DCF Calculator to stress-test your terminal growth assumptions against your WACC and instantly generate an enterprise value matrix.
2. Deep Case Study: General Dynamics FY2026 Valuation Impact
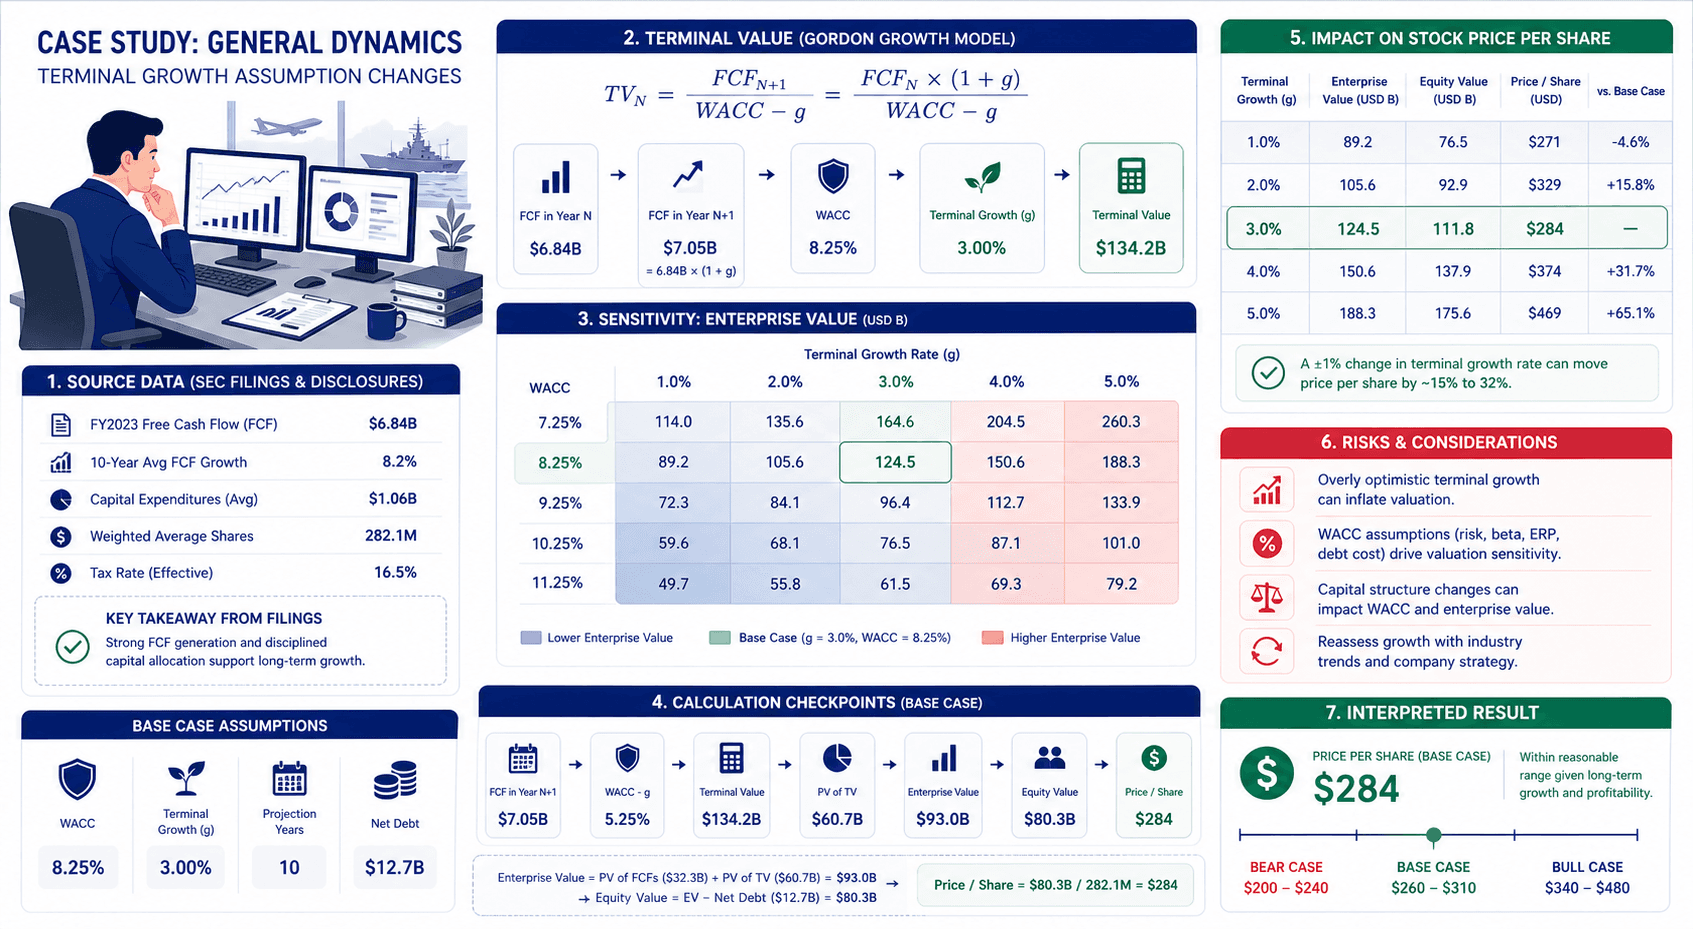
This case study uses General Dynamics (GD) FY2026 financial disclosures and market assumptions available around the FY2026 valuation date. It is an illustrative modeling example, not a current investment recommendation.
To demonstrate the extreme leverage of terminal growth assumption changes, we will apply the Gordon Growth Model to General Dynamics, a mature aerospace and defense contractor characterized by stable, predictable cash flows.
Quick Terminal Growth Example: The 30-Second Version
Before diving into complex matrices, consider a simplified DCF profile:
Terminal Year FCF: $100 Million
WACC: 9.0%
Terminal Growth Rate: 2.0%
Terminal Value = [100 × (1 + 0.02)] / (0.09 - 0.02) = 102 / 0.07 = $1,457 MillionIf we change the growth rate to 3.0%:
TV = 103 / 0.06 = $1,716 MillionA mere 1.0% change in the growth assumption increased the terminal value by nearly 18%.
Step-by-Step Matrix Construction for General Dynamics
For General Dynamics in FY2026, let us assume an illustrative modeling scenario where the projected year-5 normalized Free Cash Flow is $3.8 Billion. The baseline WACC is calculated at 7.5%, reflecting the defense sector's lower equity risk premium and stable government contracting revenue.
When presenting a valuation to an investment committee, analysts rarely provide a single point estimate. Instead, they build a two-dimensional sensitivity matrix mapping WACC against the terminal growth rate.
If we hold WACC constant at 7.5%, observe the impact of terminal growth assumption changes:
Bear Case (1.5% Growth):
TV = [3.8 × 1.015] / (0.075 - 0.015) = 3.857 / 0.060 = $64.28 BillionBase Case (2.0% Growth):
TV = [3.8 × 1.020] / (0.075 - 0.020) = 3.876 / 0.055 = $70.47 BillionBull Case (2.5% Growth):
TV = [3.8 × 1.025] / (0.075 - 0.025) = 3.895 / 0.050 = $77.90 Billion
Interpreting the Valuation Output and Sensitivity
In this General Dynamics illustration, increasing the terminal growth rate from 1.5% to 2.5% increases the terminal value by over $13.6 Billion. Because the present value of the terminal value typically constitutes 70% to 80% of the total Enterprise Value for a mature defense contractor, this single basis-point tweak fundamentally alters the implied share price.
This is why defense analysts heavily scrutinize long-term U.S. defense budget growth expectations when setting their perpetuity assumptions. A growth rate of 3.0% or higher would trigger a red flag, as it outpaces historical inflation and GDP targets, risking an indefensibly aggressive valuation.
3. How to Run This Analysis with BizToolkitPro
Manually rebuilding data tables in Excel to test terminal growth assumption changes is tedious and prone to hardcoding errors. BizToolkitPro automates this workflow, allowing you to instantly generate institutional-grade outputs.
Automating DCF Sensitivities and Parameters
Our valuation engine allows you to input your explicit cash flows, define your WACC, and instantly generate a comprehensive sensitivity matrix. You can adjust the terminal growth rate bounds (e.g., 1.0% to 3.0%) and WACC bounds (e.g., 6.5% to 8.5%) to visualize the exact valuation floor and ceiling.
Example DCF Calculator Output Explained
When you run your scenarios, the output interface provides clear, actionable metrics:
Output | What It Shows |
|---|---|
Present Value of FCFs | The discounted sum of the explicit 5- or 10-year forecast period |
Present Value of Terminal Value | The Gordon Growth TV discounted back to Year 0 using WACC |
% of EV from Terminal Value | A critical sanity check; typically ranges from 60% to 80% |
Implied Enterprise Value | Core operating value before adjusting for debt and cash |
Sensitivity Matrix | A 5x5 grid showing Enterprise Value across varying WACC and $g$ |
Implied Share Price | Equity value divided by fully diluted shares outstanding |
Put This Into Practice: Stop rebuilding spreadsheets from scratch. Run your sensitivity analysis now with our DCF Calculator — input your base cash flows, set your growth rate, and download a board-ready PDF valuation memo in under 3 minutes. If you need to refine your discount rate first, jump over to our WACC Calculator.
Frequently Asked Questions
What happens if terminal growth equals WACC?
If the terminal growth rate ($g$) exactly equals the WACC, the denominator in the Gordon Growth Model (WACC - g) becomes zero. Mathematically, dividing by zero results in an infinite terminal value. In reality, it signals a fundamentally broken assumption: no company can perpetually grow at a rate equal to or greater than its cost of capital without eventually absorbing all global wealth.
Can the terminal growth rate be negative?
Yes. For businesses in structurally declining industries (e.g., traditional print media, legacy fossil fuel extraction facing strict phase-outs), a negative terminal growth rate (e.g., -1.0% or -2.0%) is entirely appropriate. It models a perpetual, steady decay in free cash flow, yielding a finite and mathematically sound terminal value.
How does terminal growth differ from exit multiple?
The Gordon Growth Model relies on a macroeconomic perpetuity assumption. The Exit Multiple method applies a market-based valuation multiple (like EV/EBITDA) to the final forecast year's financial metric. While both calculate terminal value, GGM is intrinsic, whereas Exit Multiple relies on relative peer pricing.
Is a 3% terminal growth rate too high in 2026?
For most developed-market companies, a 3% terminal growth rate in 2026 borders on aggressive. The U.S. Federal Reserve targets a long-term inflation rate of 2%, and real GDP growth typically hovers around 1.5% to 2.0%. A 3% perpetuity growth rate implies the company will continuously outpace inflation and broad economic expansion forever.
Why does terminal value account for so much of DCF?
The terminal value captures all cash flows generated by the business from the end of the explicit forecast period (e.g., Year 6) through infinity. Because businesses are assumed to operate as ongoing concerns with perpetual lifespans, the infinite tail of stabilized cash flows mathematically outweighs the specific cash flows of the first five years, even when heavily discounted.
Should tech startups use higher terminal growth rates?
No. While a SaaS startup might experience hyper-growth (30% to 50% YoY) during its explicit 10-year forecast period, the terminal growth rate represents the company's steady state into perpetuity. Eventually, every hyper-growth startup matures into a stable corporation.
Therefore, their terminal growth rate must still be capped by long-term macroeconomic bounds (typically 2.0% to 2.5%).
Put This Theory Into Practice
Run your own scenario analysis with our math-verified calculators.