Cost of Capital Calculator: WACC vs CAPM — Which Method Should You Use?
Stop guessing which discount rate to use. CAPM isolates the cost of equity, while WACC blends debt and equity for a full enterprise view. For CFOs, the choice determines whether you're pricing a project or the entire company.
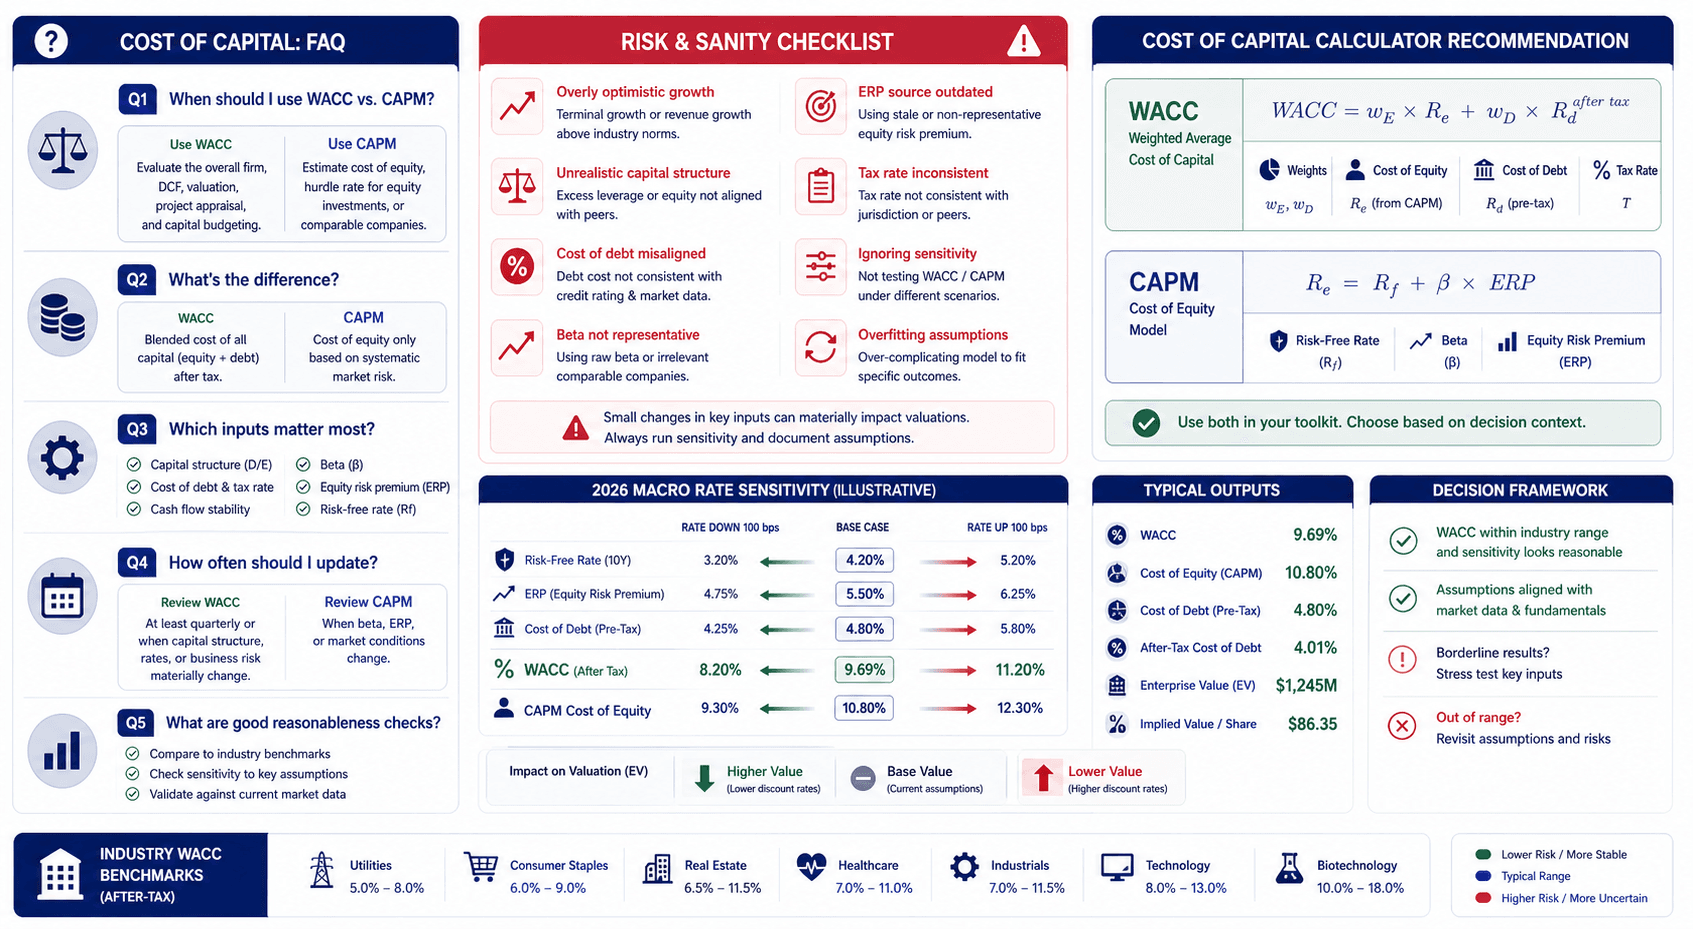
The Short Answer: WACC vs. CAPM
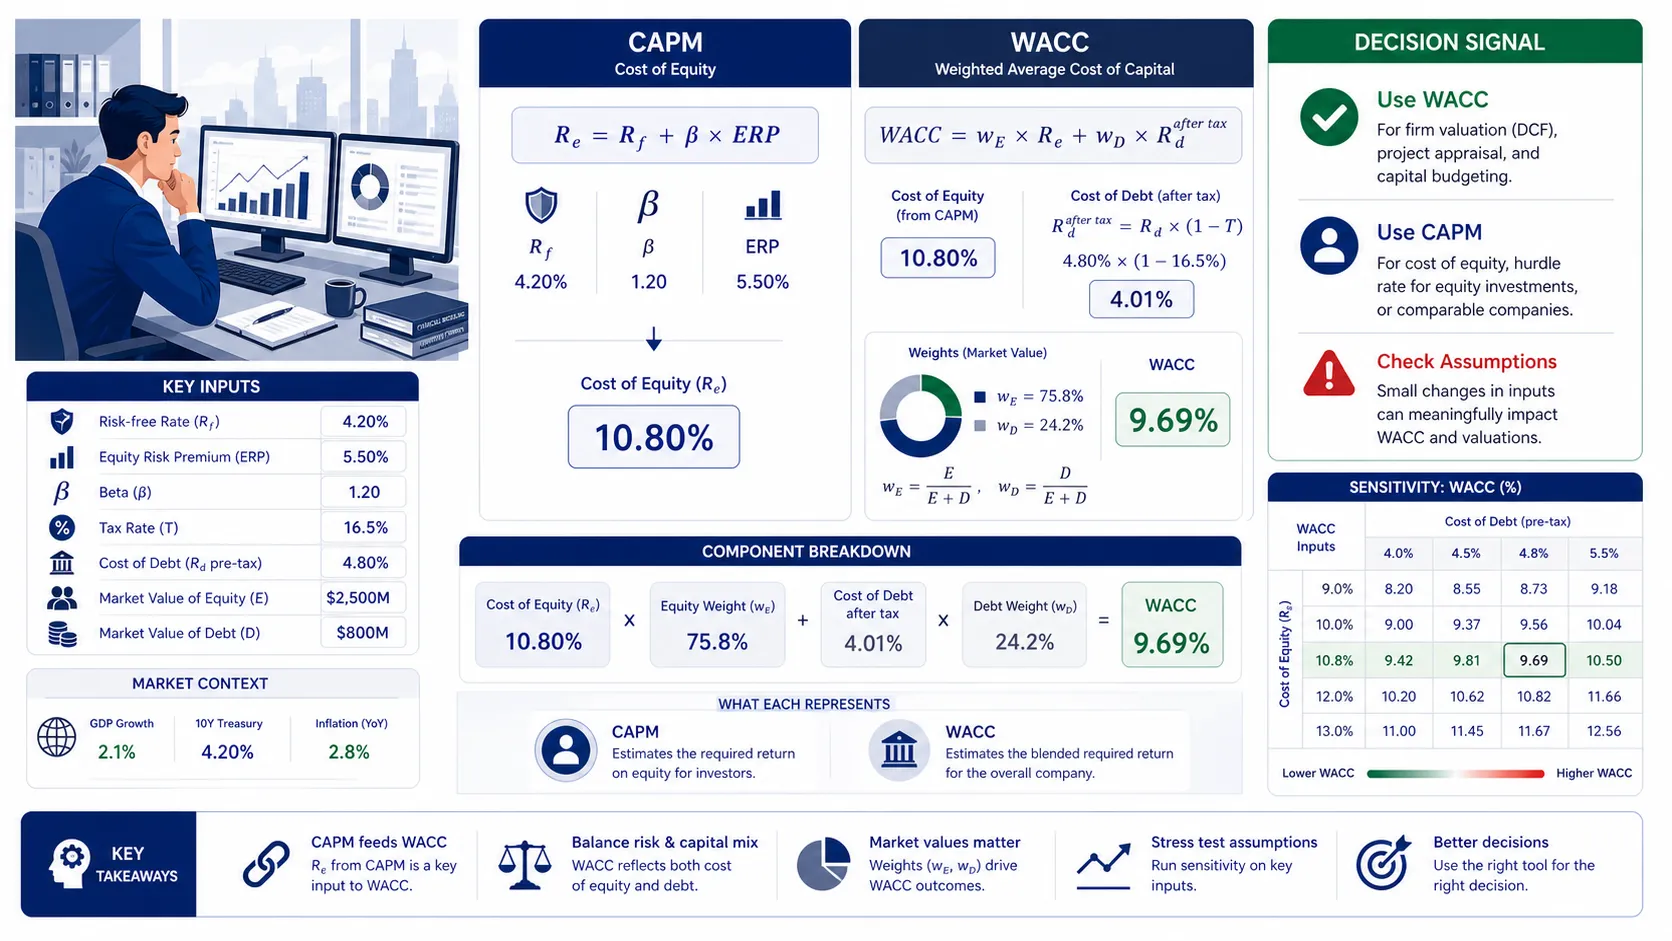
Use CAPM when you only need the cost of equity, but use WACC when valuing an entire enterprise. In 2026, typical U.S. corporate WACC ranges from 6.5% to 11.5%. WACC provides the blended discount rate covering all capital providers (debt and equity), whereas the Capital Asset Pricing Model (CAPM) is simply the formula used to calculate the equity portion inside the WACC calculation.
1. What Cost of Capital Means in Finance: The Definitive Answer
Put This Theory into Practice
Determine risk-adjusted discount rates with market weights, CAPM equity cost, and tax-shielded debt. Enter your custom inputs and simulate scenarios in our math-verified WACC Calculator.
The short answer is: cost of capital represents the minimum return a company must earn on its existing asset base to satisfy its creditors, owners, and other providers of capital. In academic and institutional finance, it is the ultimate hurdle rate.
If a company's Return on Invested Capital (ROIC) falls below its Weighted Average Cost of Capital (WACC), the company is actively destroying shareholder value, regardless of top-line revenue growth.
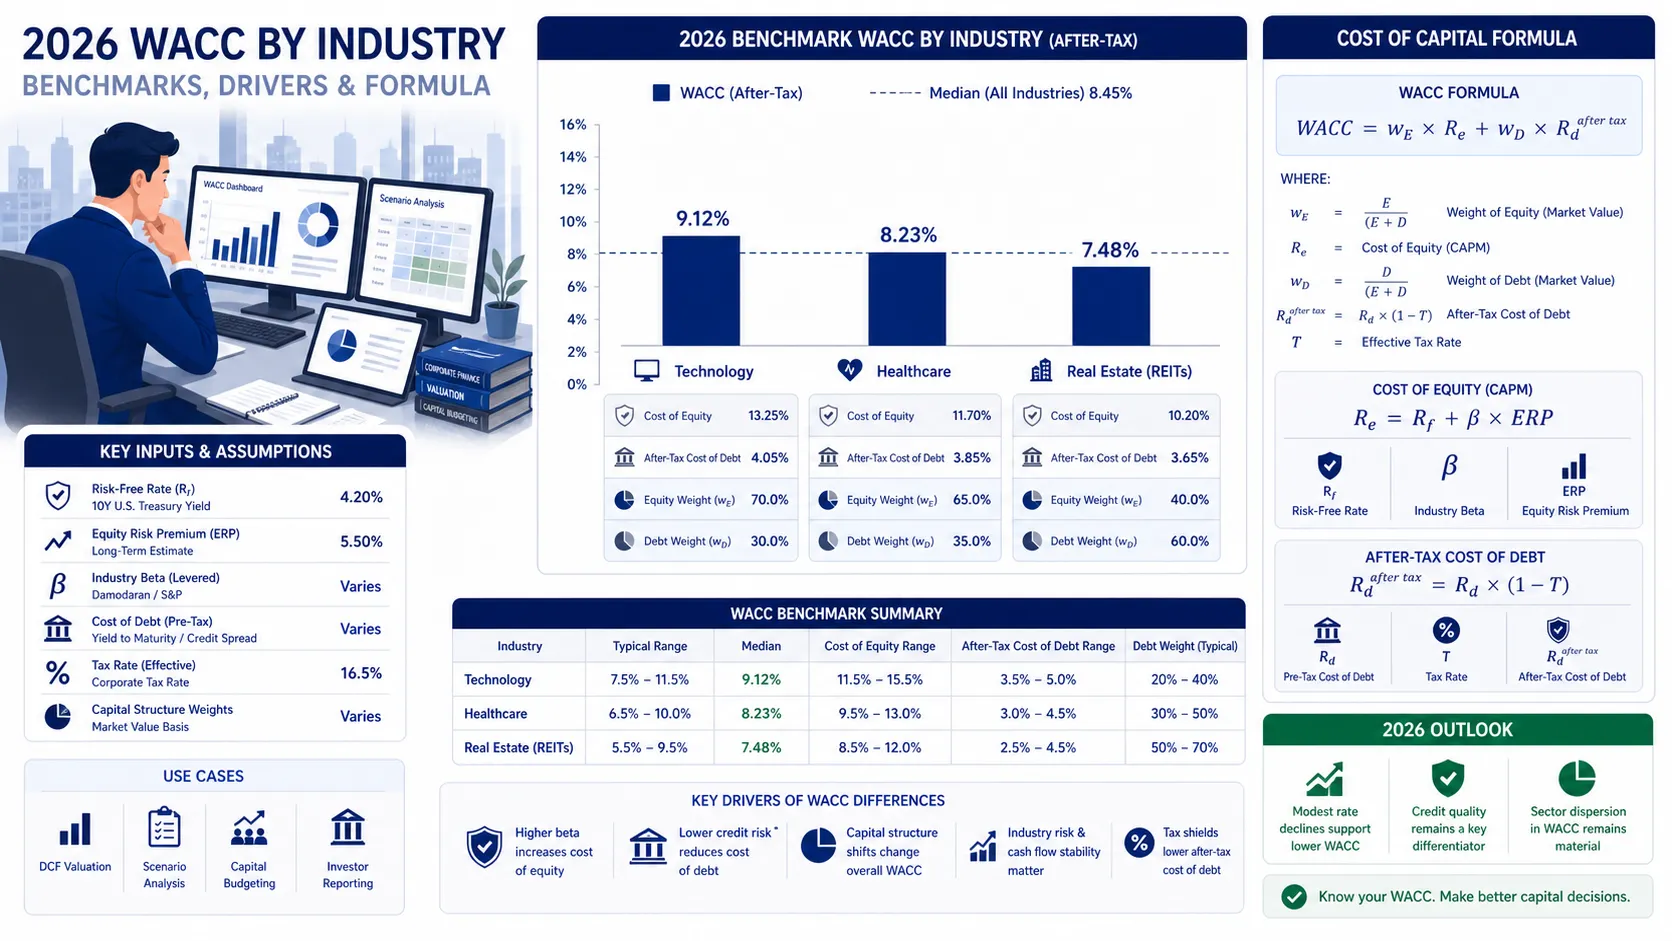
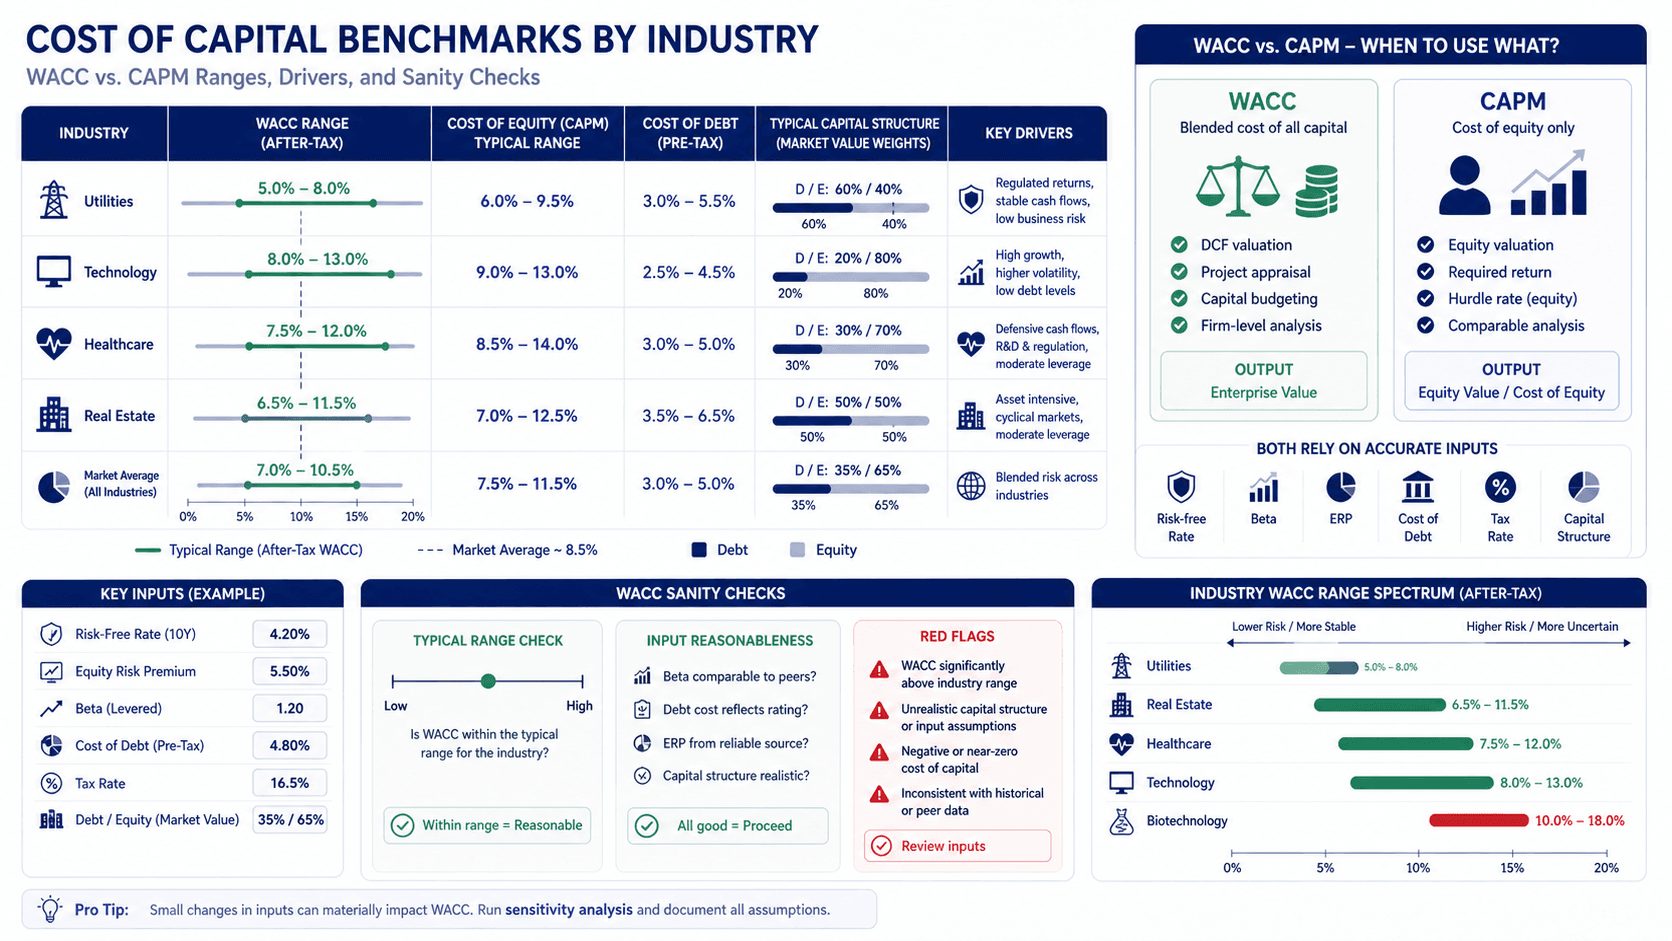
2026 WACC by Industry Benchmarks
When using a cost of capital calculator, you need a baseline to determine if your output is reasonable. Based on 2026 market data, here are the typical benchmark ranges:
Industry | Typical WACC Range | What the Range Usually Signals |
|---|---|---|
Utilities & Infrastructure | 5.5% – 7.0% | Heavy debt loads, highly predictable regulated cash flows, low beta. |
Consumer Staples | 6.5% – 8.0% | Stable consumer demand, moderate leverage, lower equity risk. |
Real Estate (REITs) | 6.5% – 8.5% | Asset-backed borrowing, high leverage offset by stable rental yields. |
Technology (Mature) | 8.0% – 10.5% | Lower debt utilization, higher market beta, premium growth expectations. |
Biotech & Software (Growth) | 10.0% – 15.0%+ | Near-zero debt, extreme reliance on high-cost equity, binary risk profiles. |
Note: If your calculated WACC falls outside the industry median by more than ±200 basis points, do not immediately assume your company is an anomaly. First, audit your input parameters (like Beta and the equity risk premium).
Calculate It Yourself: Try our WACC Calculator to apply these concepts to your own scenario instantly, blending your debt and equity costs accurately.
Why a Lower Cost of Capital Is Not Always Better
A common misconception among junior analysts is that minimizing WACC is the ultimate goal of corporate finance. While a lower discount rate mathematically increases a company's present value, aggressively artificially lowering WACC usually involves taking on dangerous levels of debt.
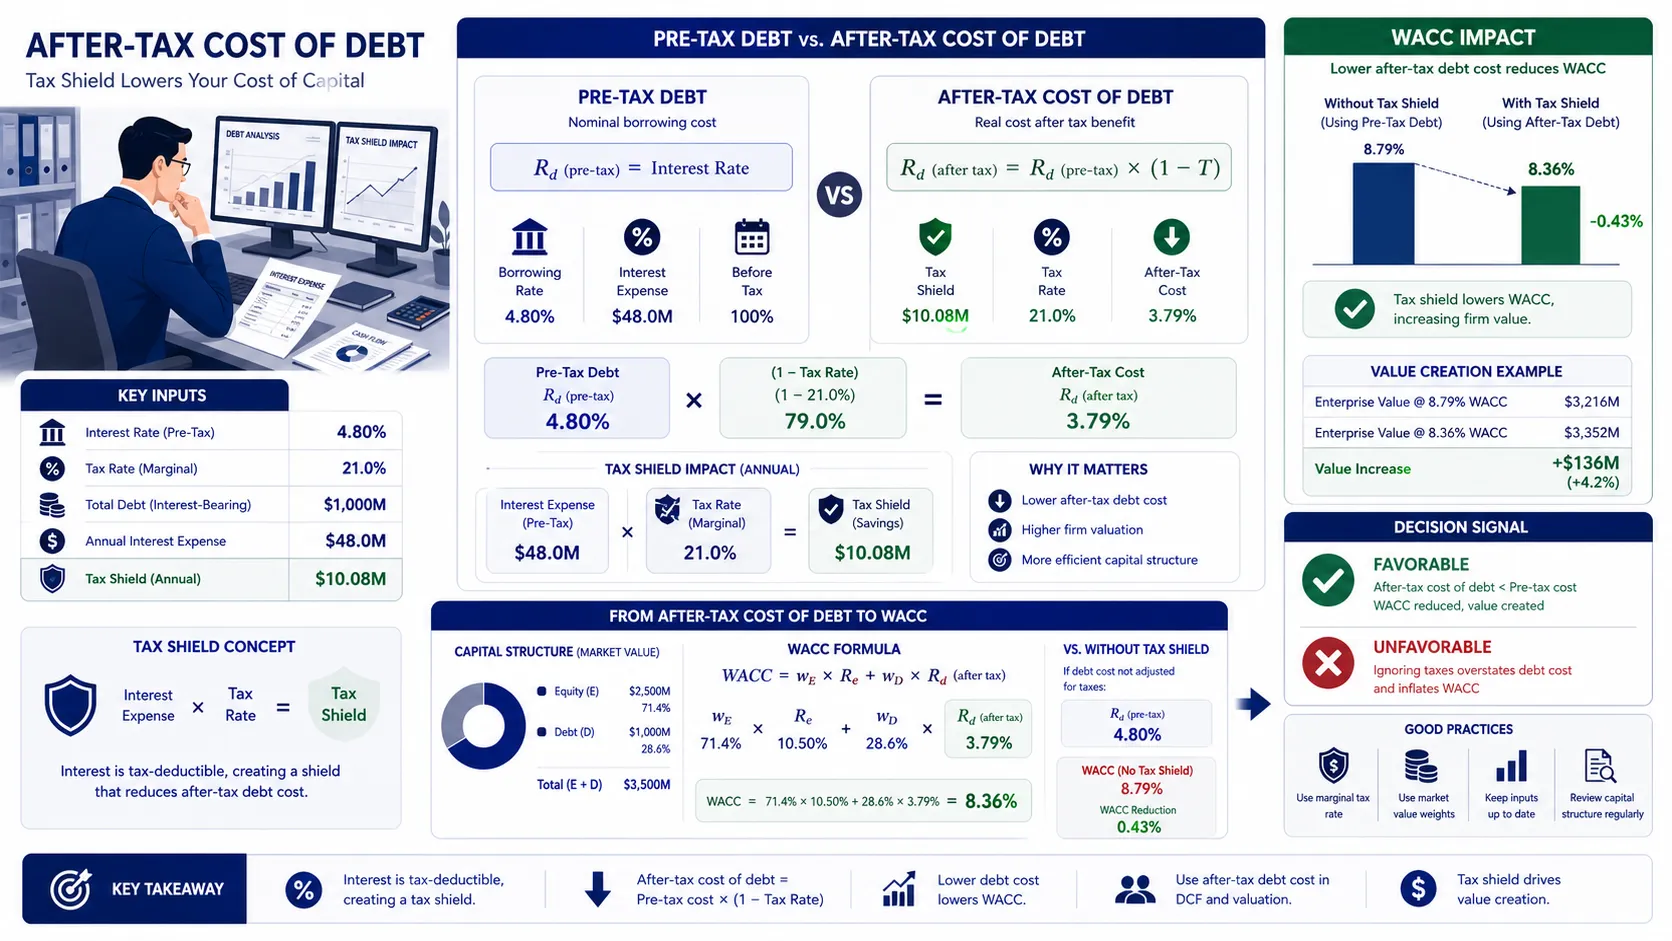
Debt is cheaper than equity (partly due to the tax shield), so adding debt initially lowers WACC. However, crossing the optimal capital structure threshold dramatically increases bankruptcy risk. This causes both debt investors to demand higher yields and equity investors to demand a higher CAPM return to compensate for the financial distress risk, ultimately causing the true WACC to spike.
Cost of Capital Red Flag Checklist
When running a cost of capital calculator, watch out for these critical modeling errors that immediately invalidate a valuation model:
Red Flag | Why It Matters |
|---|---|
Using Book Value for Equity Weight | Capital structure weights (E/V and D/V) must always use the market value of equity, not the accounting book value from the balance sheet. |
Applying CAPM as the Total Discount Rate | CAPM only measures the cost of equity. Using it to discount unlevered free cash flows in a DCF overstates risk and undervalues the enterprise. |
Cost of Debt > Cost of Equity | Equity is inherently riskier than debt (which has liquidation priority). If your calculated cost of debt exceeds your CAPM equity cost, your inputs are broken. |
Using Short-Term Risk-Free Rates | For long-term DCF valuations, using a 1-year Treasury yield artificially suppresses the CAPM output. Always use the 10-year Treasury yield. |
Ignoring the Tax Shield on Debt | Interest expenses are tax-deductible. Failing to multiply the pre-tax cost of debt by |
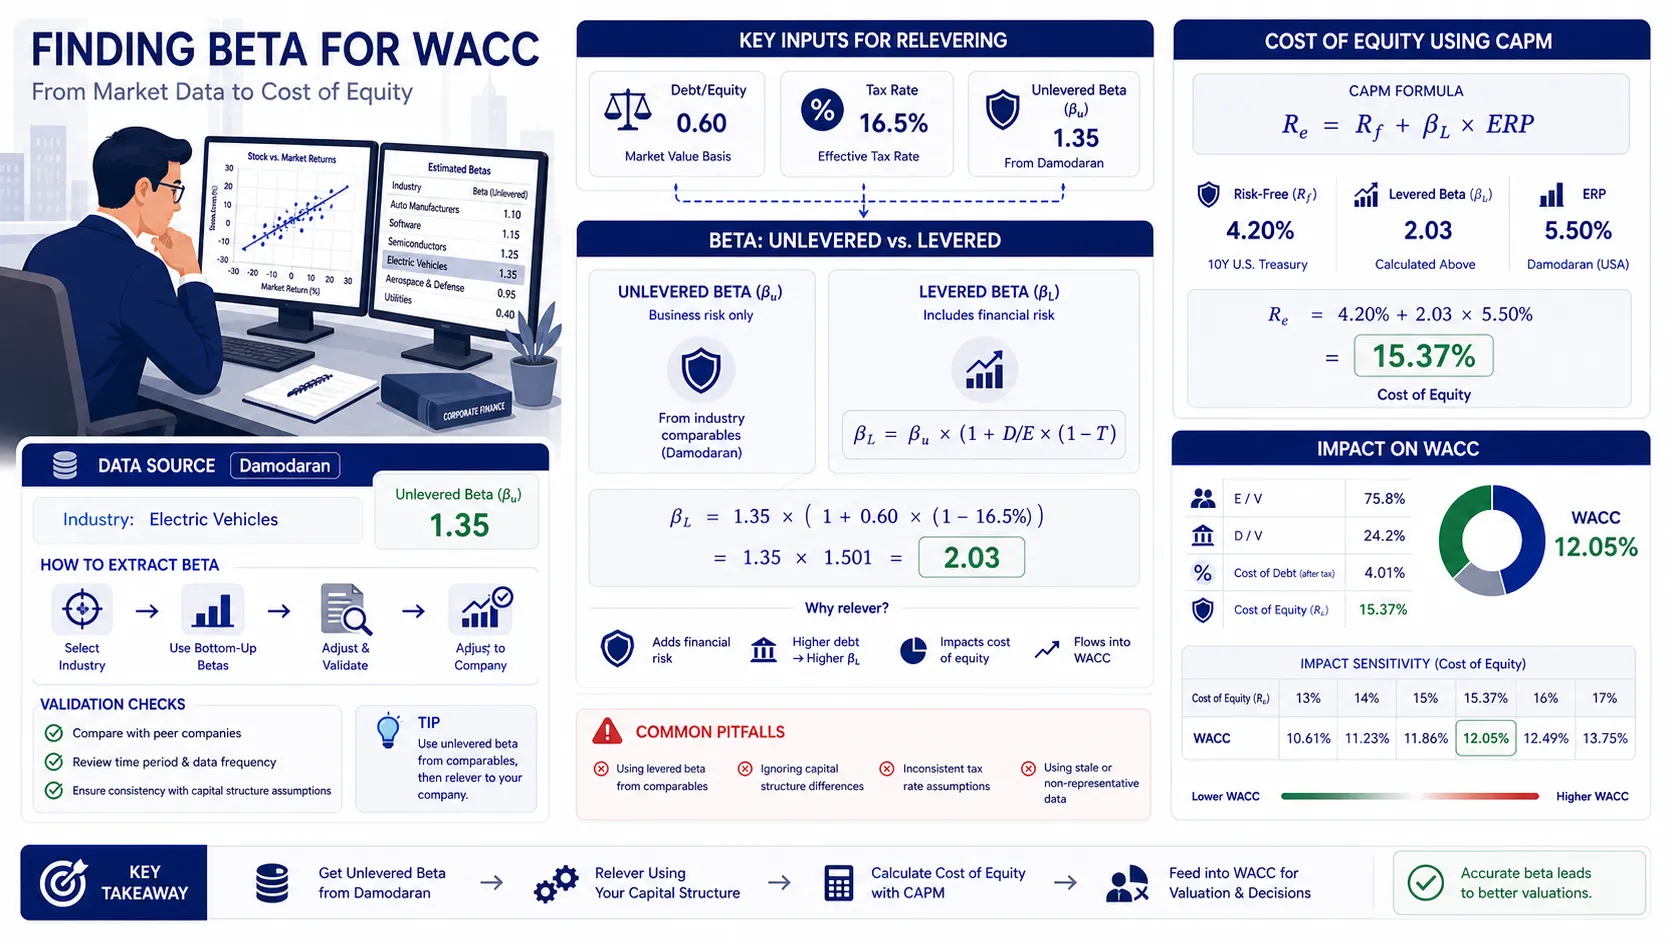
Stale Beta Coefficients | Using a 5-year historical Beta for a company that recently underwent a massive M&A transformation misrepresents its current risk profile. |
Frequently Asked Questions
Is a WACC above 12% a red flag?
Not necessarily, but it depends entirely on the sector and company stage. For a mature utility company, a 12% WACC is a massive red flag signaling severe financial distress or miscalculation. However, for a pre-IPO biotechnology firm or a high-growth SaaS startup relying entirely on venture capital (equity), a WACC of 12% to 15% is standard and accurately reflects the venture risk.
What is a bad cost of capital?
A "bad" cost of capital is one that exceeds the company's Return on Invested Capital (ROIC). If a company's WACC is 9% but its projects only generate a 7% return, it operates at a value deficit. Conversely, a mathematically flawed WACC—such as one calculated using book values instead of market values—is also "bad" because it leads to incorrect capital budgeting decisions.
Should I use WACC or CAPM for a DCF model?
You must use WACC when discounting Unlevered Free Cash Flow (UFCF) to arrive at the Enterprise Value. This is the standard method for 95% of DCF models. You should only use the CAPM rate if you are specifically discounting Levered Free Cash Flow (FCFE) to arrive directly at Equity Value, which is a much less common approach used primarily for financial institutions like banks.
Why does WACC decrease when a company takes on more debt?
WACC initially decreases with debt because debt is fundamentally cheaper than equity. Creditors have a senior claim on assets in bankruptcy, making their risk lower than shareholders'. Furthermore, interest payments on debt are tax-deductible, creating a "tax shield" that further reduces the effective cost of debt.
However, this effect reverses if the company takes on too much debt, triggering distress costs.
How do 2026 interest rates affect my cost of capital?
In 2026, the risk-free rate (anchored by the 10-year Treasury) sets the floor for the entire WACC calculation. When macro interest rates rise, the risk-free rate in the CAPM formula increases, driving up the cost of equity. Simultaneously, the yields demanded by bondholders rise, increasing the cost of debt.
Therefore, higher interest rates universally push a company's cost of capital higher, depressing enterprise valuations.
Is it possible for CAPM to equal WACC?
Yes, but only in one specific scenario: if a company has absolutely zero debt and zero preferred stock in its capital structure. In a 100% equity-funded company, the weight of equity is 100%, meaning the Weighted Average Cost of Capital is simply equal to the cost of equity derived from the CAPM formula.
Put This Theory Into Practice
Run your own scenario analysis with our math-verified calculators.