CAPM Explained: How to Calculate Cost of Equity for Your WACC Model
Unlock precise WACC valuations by mastering CAPM: the formula that translates market risk into your company's exact cost of equity, a critical step CFOs can't afford to guess.
CAPM Cost of Equity Explained
Cost of Equity (Re) = Rf + [Beta × ERP]The Capital Asset Pricing Model (CAPM) isolates the return equity investors demand for taking on market risk. By adding the Risk-Free Rate (Rf) to the product of the company's Beta and the market Equity Risk Premium (ERP), analysts determine the exact cost of equity to plug into their broader Weighted Average Cost of Capital (WACC) valuation models.
In institutional practice, finding the cost of debt is relatively straightforward—you look at the yield to maturity on a company's outstanding bonds. Finding the cost of equity, however, is an exercise in theoretical finance because equity has no stated coupon rate.
Shareholders implicitly demand a return based on the volatility of the stock relative to the broader market. The CAPM cost of equity calculation is the undisputed industry standard for quantifying this hidden cost.
Put This Theory into Practice
Determine risk-adjusted discount rates with market weights, CAPM equity cost, and tax-shielded debt. Enter your custom inputs and simulate scenarios in our math-verified WACC Calculator.
1. Understanding the CAPM Framework in Corporate Finance

The CAPM operates on a brilliantly simple premise: investors require a guaranteed baseline return (the risk-free rate) plus additional compensation proportional to the specific risk they take on by buying a stock instead of a government bond.
CAPM Formula Breakdown and Key Inputs
The formula is universally accepted as:
Re = Rf + (β × ERP)
To execute this equation accurately, you need three highly specific inputs anchored in current market data:
Input | Source | Example (FY2026) |
|---|---|---|
Risk-Free Rate ($Rf$) | 4.3% | |
Equity Beta ($\beta$) | Bloomberg / Capital IQ / Yahoo Finance | 1.15 |
Equity Risk Premium ($ERP$) | 5.0% |
Common Cost of Equity Modeling Mistakes
When analysts build a CAPM model, they frequently make errors that compound disastrously once plugged into a DCF. Watch out for these modeling mistakes:
Using Short-Term T-Bills for Long-Term Valuations: Discounting 10 years of cash flows using a 1-year Treasury yield causes a duration mismatch that artificially lowers the cost of equity.
Using Unlevered Beta Directly in CAPM: The Beta in the standard CAPM formula must be Levered Beta. Unlevered Beta strips out the risk of debt, which means using it directly will severely underprice the risk facing the equity shareholders.
Double-Counting Inflation: Adding an inflation premium on top of the 10-year Treasury yield. The 10-year yield is nominal; it already has market inflation expectations baked in.
Applying Stale Equity Risk Premiums: The ERP fluctuates with macroeconomic panic and exuberance. Using a historical 6.5% ERP from 2008 in a stable 2026 market will artificially inflate the discount rate and crater the valuation.
Selecting Data Sources: Damodaran vs Bloomberg
While you can pull Beta from retail sources like Yahoo Finance, institutional analysts rely on Bloomberg terminal outputs or the rigorous academic datasets maintained by Professor Aswath Damodaran at NYU Stern. Damodaran’s annual implied ERP metrics are considered the gold standard for independent valuation modeling, stripping away the noise of day-to-day market volatility.
💡 Pro Tip: Ready to run this calculation instantly? Use our WACC Calculator — simply enter your Beta and Risk-Free Rate, and the engine automatically builds out your Cost of Equity and blends it into your capital structure.
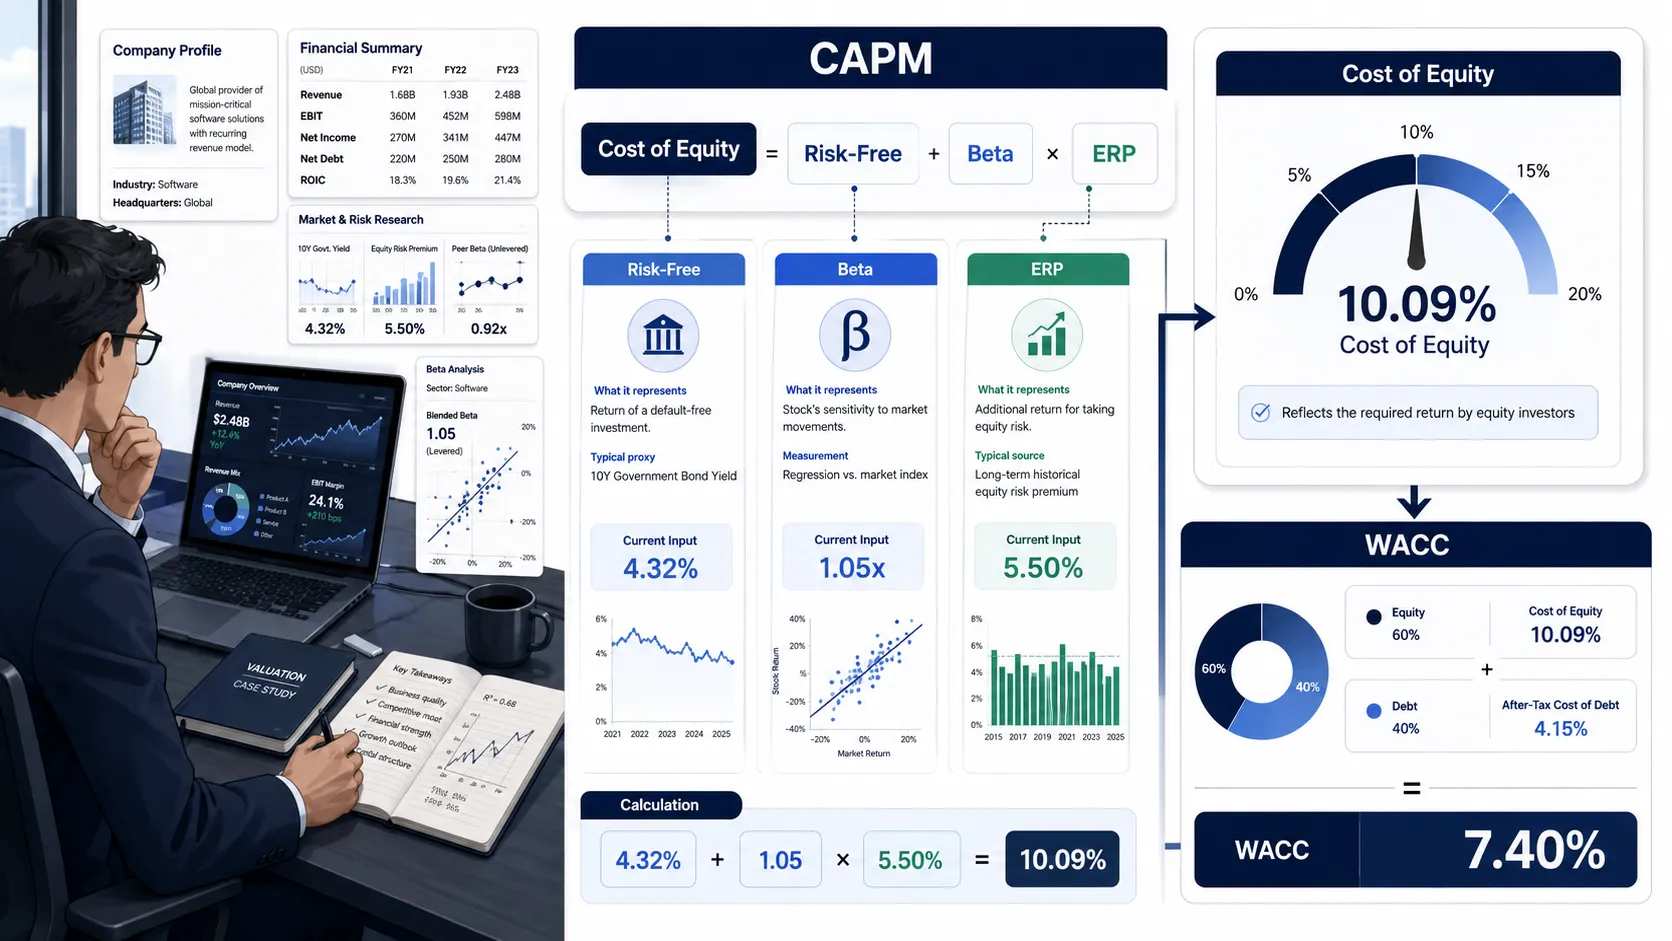
2. Deep Case Study: Applying CAPM to Tesla FY2026

This case study uses Tesla, Inc. (TSLA) FY2026 financial disclosures and market assumptions available around the FY2026 valuation date. It is an illustrative modeling example, not a current investment recommendation.
To demonstrate the CAPM in an extreme environment, we will look at Tesla, a company known for immense price volatility and a highly debated risk profile among institutional investors.
Quick CAPM Example: The 30-Second Version
Before analyzing Tesla's high-beta environment, consider a stable consumer staples company:
Risk-Free Rate: 4.0%
Beta: 0.8 (Less volatile than the market)
ERP: 5.0%
Cost of Equity = 4.0% + (0.8 × 5.0%) = 4.0% + 4.0% = 8.0%This stable company is "cheap" to fund with equity.
Step-by-Step CAPM Calculation for Tesla
For Tesla in FY2026, let us establish illustrative inputs. Tesla operates in capital-intensive manufacturing, AI software, and energy storage, leading to wild stock swings compared to the S&P 500. We will assume an illustrative Levered Beta of 2.0.
Risk-Free Rate ($Rf$): 4.3% (U.S. 10-Year Treasury)
Levered Beta ($\beta$): 2.0
Equity Risk Premium ($ERP$): 5.2% (Reflecting a slightly elevated market risk environment)
Plugging this into the CAPM formula:
Re = 4.3% + (2.0 × 5.2%) Re = 4.3% + 10.4% Re = 14.7%
Interpreting the High-Beta Sensitivity
Tesla's calculated Cost of Equity is 14.7%, which is exceptionally high for an S&P 500 mega-cap company. Because Tesla's Beta is 2.0, the company essentially absorbs double the market's equity risk premium.
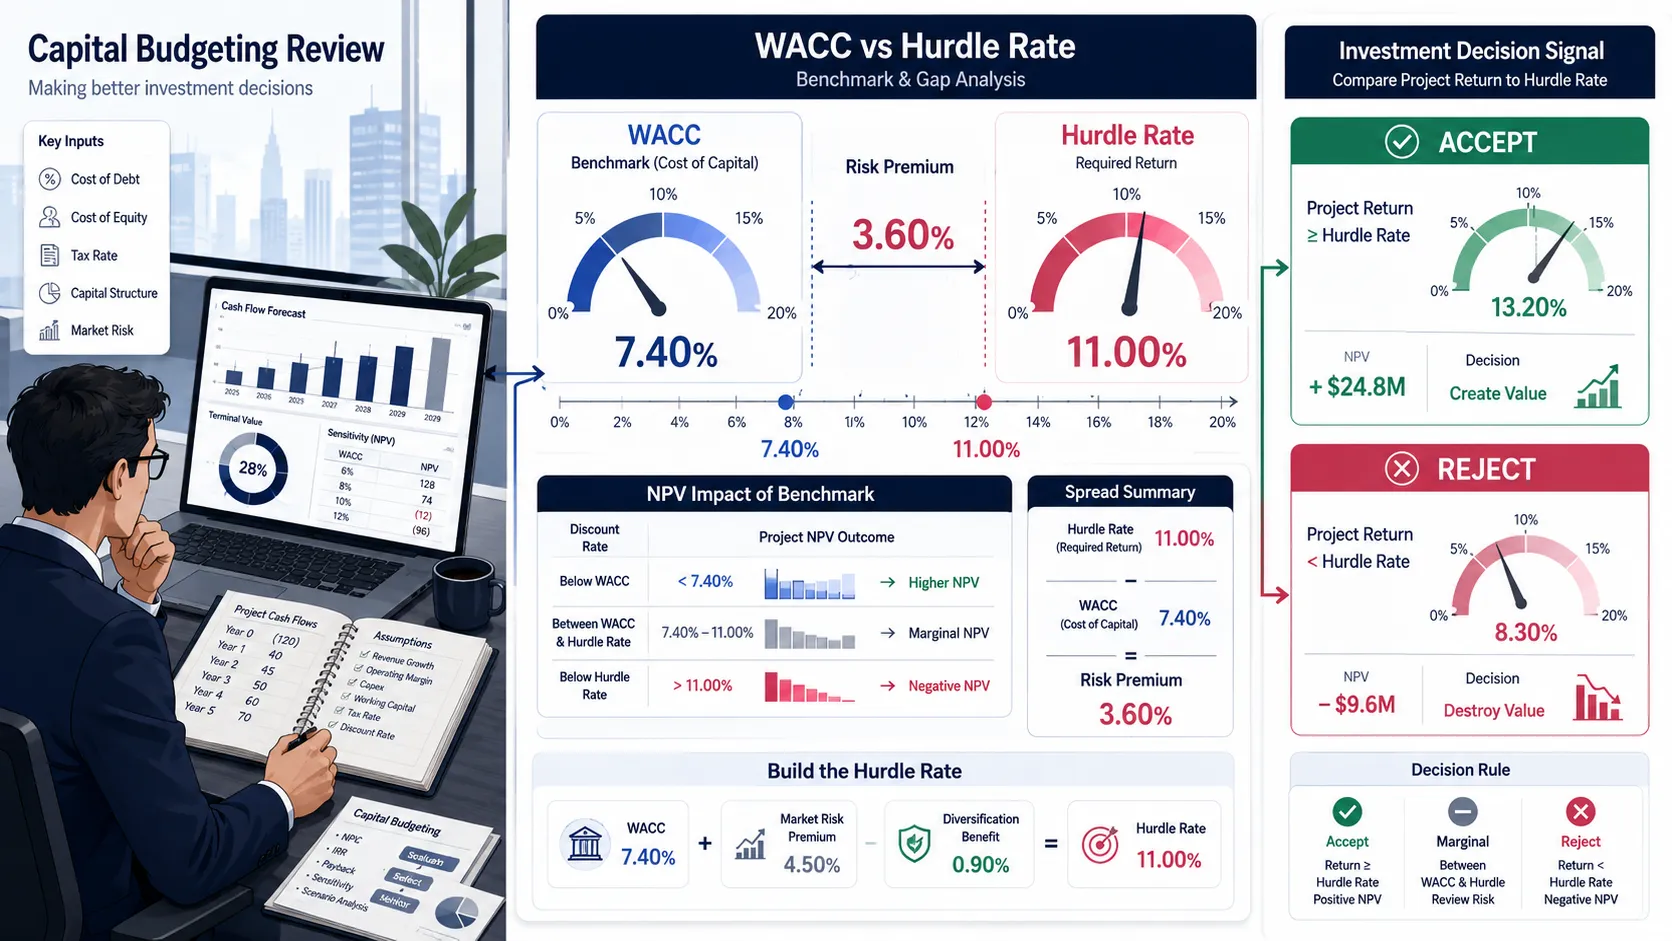
In a DCF model, this 14.7% hurdle rate acts as a massive anchor. For Tesla to justify its valuation, it cannot simply grow revenues at 10%—its future cash flows must be so massive and grow so quickly that they can mathematically overcome being discounted by nearly 15% per year.
If the broader market experiences a shock and the ERP jumps to 6.0%, Tesla's cost of equity would instantly rocket to 16.3% (4.3% + [2.0 × 6.0%]), aggressively crushing its present value.
3. How to Run This Analysis with BizToolkitPro

Manually tweaking CAPM inputs in Excel to see how Beta shifts affect your ultimate WACC is slow and prone to linking errors.
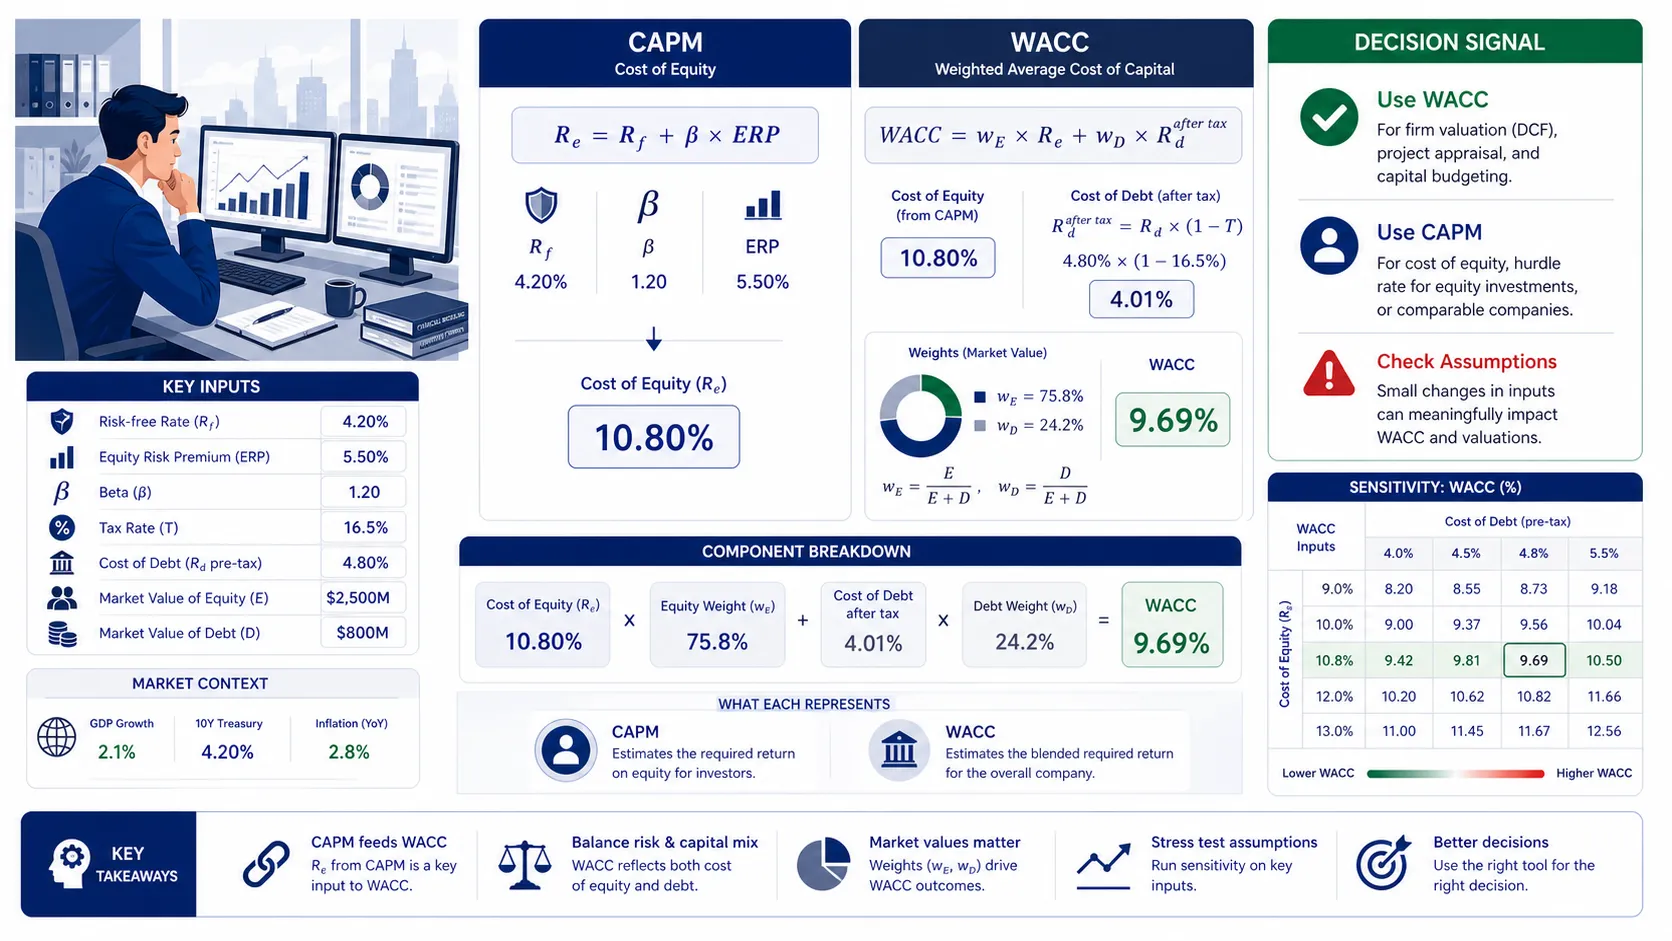
Automating the CAPM to WACC Pipeline
With BizToolkitPro, the CAPM calculation is natively integrated into the WACC engine. You define your Risk-Free Rate, your target company's Beta, and your preferred Equity Risk Premium. The system instantly calculates $Re$ and passes it directly into the overarching WACC formula alongside your debt inputs.
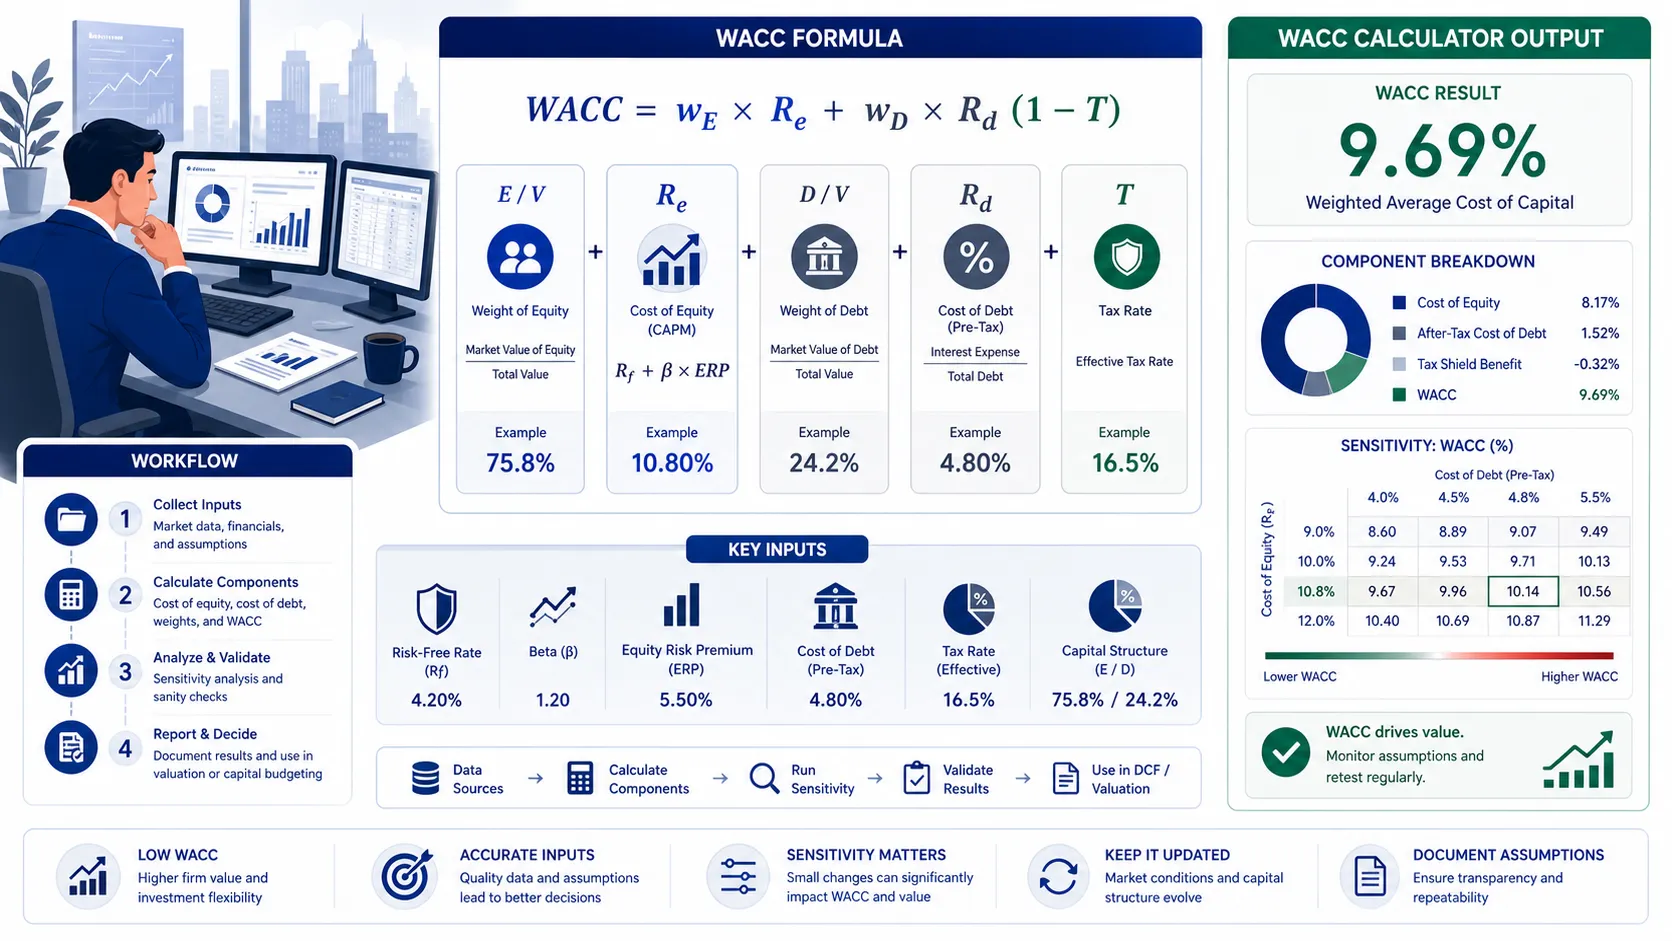
Example Calculator Output Explained
When you run your CAPM scenario inside the tool, you receive a clear breakdown of how the equity cost impacts the total business:
Example WACC Calculator Output | What It Shows |
|---|---|
Cost of Equity (CAPM) | The isolated $Re$ value (e.g., 14.7% for Tesla) |
Equity Weight (E/V) | The percentage of the company funded by this expensive equity |
The isolated, tax-shielded cost of borrowing | |
Final WACC | The blended discount rate for your DCF model |
Sensitivity Matrix | Visualizes how WACC changes if Beta shifts by ±0.2 |
Put This Into Practice: Stop manually linking your CAPM cells to your WACC schedules. Run your analysis now with our WACC Calculator — enter your Beta and Risk-Free assumptions, immediately see your Cost of Equity, and download a board-ready PDF memo in under 3 minutes.
Frequently Asked Questions
Why do we use the 10-year Treasury as the risk-free rate?
Valuing a company via a DCF involves forecasting cash flows 5 to 10 years into the future. Therefore, the discount rate used must match the duration of the cash flows being discounted. The 10-year U.S. Treasury Note is considered risk-free regarding default, and its duration aligns perfectly with standard corporate valuation timelines.
What is a normal equity risk premium in 2026?
A "normal" ERP typically fluctuates between 4.5% and 6.0%. It represents the extra return investors demand for holding risky stocks instead of guaranteed government bonds. During times of economic panic, the ERP expands; during long bull markets, it contracts. In 2026, many institutional models anchor around 5.0%.
Can a company have a negative Beta?
Yes, but it is exceedingly rare. A negative Beta implies the asset moves inversely to the stock market. Gold or specialized hedging instruments might have a negative Beta. If a company somehow had a negative Beta, its Cost of Equity would mathematically be lower than the Risk-Free rate, which defies the core logic of corporate risk.
Should I use Levered or Unlevered Beta for CAPM?
You must use Levered Beta. The CAPM calculates the cost of equity for shareholders, and shareholders bear the financial risk of the company's debt load. Levered Beta includes this debt risk. Unlevered Beta is only used when comparing peer companies; you must "re-lever" it to the target company's specific debt-to-equity ratio before plugging it into CAPM.
Does CAPM apply to private companies?
Yes, but with modifications. Private companies do not have publicly traded stock, so they have no observable Beta. Analysts solve this by finding publicly traded peer companies, unlevering their Betas to remove the peers' debt effects, taking the median, and then re-levering that Beta using the private company's target capital structure.
How do I add a size premium to the CAPM formula?
Standard CAPM assumes all companies are highly liquid mega-caps. For smaller, illiquid companies (like micro-caps or private startups), analysts often use the "Modified CAPM," which adds a Size Premium (SP) to the end of the formula: Re = Rf + (β × ERP) + SP. This compensates investors for the inherent risk and illiquidity of small businesses.
Put This Theory Into Practice
Run your own scenario analysis with our math-verified calculators.